Automate SaaS Churn Alerts with Postman: Step-by-Step
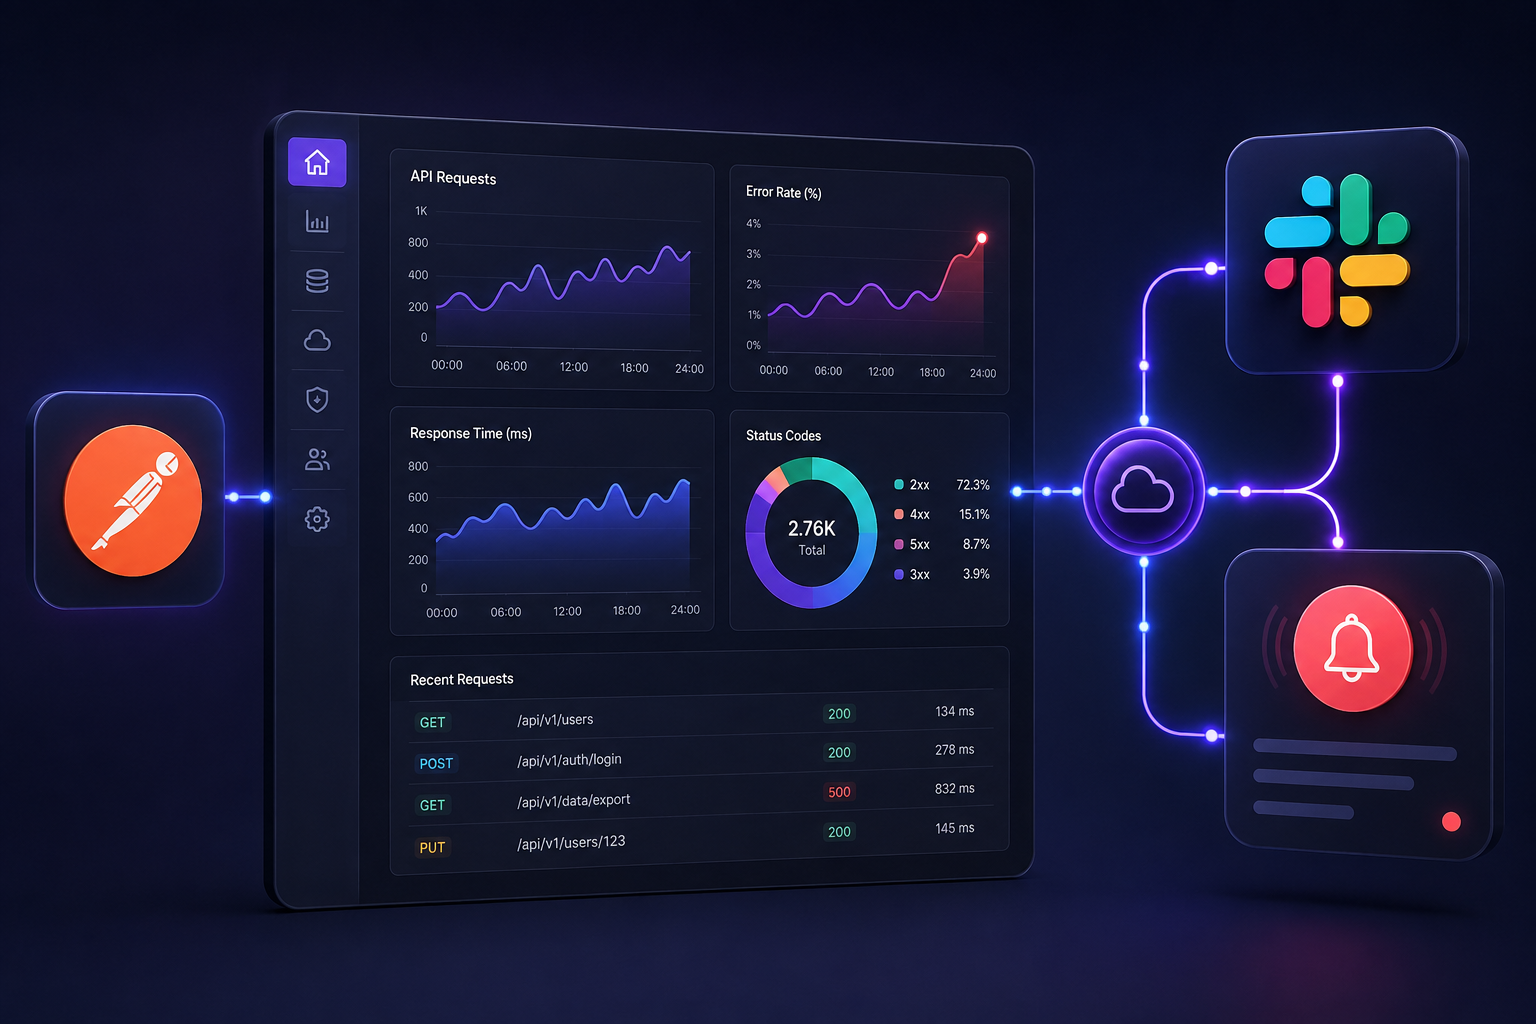
The Quick Answer: How to Automate SaaS Churn Alerts in Postman
You do not need an expensive Customer Success Platform like Gainsight or Totango just to catch cancellation signals before an account leaves. You can build an automated, real-time churn alert system using Postman Monitors, your app's existing analytics or database REST APIs, and Slack or Microsoft Teams webhooks.
To automate SaaS churn alerts with Postman, you configure a Postman Collection that queries your application database or telemetry endpoint for negative health signals (such as a 50% drop in weekly active logins or zero feature usage over 14 days). You add a post-response script in JavaScript that evaluates the payload. If an account meets your churn-risk criteria, the script immediately fires a POST request to a Slack or Microsoft Teams Webhook URL with account details. Finally, you set up a Postman Monitor to run this collection on a scheduled cadence, such as every 6 or 24 hours.
Here is a high-level summary of the architectural flow:
- Data Fetching: Postman sends a GET request to your product telemetry API, billing endpoint (such as the Stripe API), or database proxy.
- Logic Evaluation: A post-response script runs inside Postman to analyze thresholds like seat utilization, downgraded billing plans, or inactivity.
- Alert Trigger: If a risk threshold is breached, Postman triggers a secondary POST request payload to an incoming webhook in your team's communications channel.
- Automated Scheduling: A Postman Monitor runs the entire collection periodically in the cloud without local machine dependencies.
Why Traditional Churn Detection Fails SaaS Companies
Most SaaS companies discover a customer is churning when a cancellation request hits their inbox or when a Stripe webhook emits a customer.subscription.deleted event. By the time a billing system reports a cancellation, the decision was made weeks or months prior. Passive churn detection is an autopsy, not an intervention.
To prevent churn, customer success and growth teams need early behavioral signals. Customers rarely stop using a SaaS platform overnight; they gradually disengage. Common leading indicators include:
- Usage Deceleration: A drop in core action frequency (for example, an email marketing tool user sending 80% fewer campaigns over two weeks).
- Seat Abandonment: A team licensed for 20 seats suddenly dropping to 2 active weekly users.
- Admin Inactivity: The account owner or paying admin failing to log in for 14 consecutive days.
- Repeated In-App Failures: High error rates during high-value workflows (such as CSV import failures or API rate-limit breaches).
- Export Spikes: A sudden bulk export of contacts, data, or project history—a classic sign of account migration.
Waiting for engineering to build internal dashboards or waiting for budget approval on enterprise customer success tools often leaves these signals hidden. Postman provides a practical middle ground: it leverages existing REST endpoints, requires minimal code, executes reliably on cloud schedules, and delivers real-time notifications directly to your team.
Core System Requirements & Prerequisites
Before building your automated churn workflow in Postman, ensure you have the following components in place:
- A Postman Account: Free or paid tier (the free tier includes up to 1,000 monitor runs per month, which is more than enough for daily churn runs).
- A SaaS Telemetry or Database API Endpoint: A secure GET endpoint that returns customer activity data. This can be your internal admin API, a Segment/Mixpanel API, a database interface, or even the Stripe API for financial churn signals.
- Authentication Credentials: An API key, Bearer token, or OAuth 2.0 credential authorized to read customer usage metadata.
- A Notification Endpoint: An Incoming Webhook URL from Slack, Microsoft Teams, Discord, or an email service like Postmark/SendGrid.
Step-by-Step: Setting Up Churn Alerts with Postman
Let's walk through building a complete automated churn alert system from scratch.
Step 1: Design the Churn Risk API Payload
Your first step is identifying which endpoint supplies customer health data. For this example, let's assume your product team exposes an internal route like https://api.yourcompany.com/v1/admin/customer-health that returns account metadata.
A typical JSON response from a customer health endpoint looks like this:
json { "status": "success", "data": [ { "account_id": "acc_98765", "company_name": "Acme Corp", "plan": "Enterprise", "mrr": 1200, "active_users_last_7_days": 1, "active_users_previous_7_days": 18, "days_since_last_admin_login": 12, "health_score": 32 }, { "account_id": "acc_43210", "company_name": "TechStart Inc", "plan": "Pro", "mrr": 299, "active_users_last_7_days": 12, "active_users_previous_7_days": 11, "days_since_last_admin_login": 1, "health_score": 91 } ] }
In this payload, Acme Corp exhibits two severe churn signals: an 88% drop in active users week-over-week and 12 days of admin inactivity, driving their overall health score down to 32.
Step 2: Create a Dedicated Postman Collection and Environment
Open Postman and create a new collection named SaaS Early Churn Warning System.
Next, set up a Postman Environment named Production Alerts to securely manage variables across environments without hardcoding credentials into your requests.
Define the following variables in your environment:
- baseUrl: https://api.yourcompany.com/v1
- apiToken: Your private Bearer token or secret key
- slackWebhookUrl: https://hooks.slack.com/services/T00/B00/X000000 (Replace with your actual incoming webhook)
- healthThreshold: 50 (Accounts with a health score below this threshold trigger an alert)
Step 3: Configure the Data Retrieval Request
Inside your collection, create a new request titled 1. Fetch Customer Health Metrics.
- Method: GET
- URL: {{baseUrl}}/admin/customer-health
- Headers:
- Authorization: Bearer {{apiToken}}
- Content-Type: application/json

Click Send to verify that your credentials work and that the payload structure matches your expectations.
Step 4: Add Post-Response Script Logic (Tests Tab)
Postman allows you to run JavaScript after receiving an API response using the Scripts / Tests tab. We will use this tab to iterate over all customer records, isolate high-risk accounts, and store their details in a collection variable to pass to our notification request.
Navigate to the Scripts -> Post-response tab of your Fetch Customer Health Metrics request and paste the following JavaScript:
javascript // Parse the JSON response const responseData = pm.response.json(); const threshold = parseInt(pm.environment.get("healthThreshold")) || 50;
// Array to store identified at-risk accounts let churnRiskAccounts = [];
// Ensure the request was successful and data exists if (pm.response.to.have.status(200) && responseData.data) { responseData.data.forEach(account => { // Primary Churn Logic: Health score under threshold OR drastic active user drop const userDropPercentage = account.active_users_previous_7_days > 0 ? ((account.active_users_previous_7_days - account.active_users_last_7_days) / account.active_users_previous_7_days) * 100 : 0;
if (account.health_score < threshold || userDropPercentage >= 60) { churnRiskAccounts.push({ id: account.account_id, name: account.company_name, plan: account.plan, mrr: account.mrr, score: account.health_score, drop: userDropPercentage.toFixed(1), adminInactiveDays: account.days_since_last_admin_login }); } });
// Save the flagged accounts to a collection variable for the next request pm.collectionVariables.set("flaggedAccounts", JSON.stringify(churnRiskAccounts));
// Standard Postman Assertion pm.test("Check for Churn Risks", function () { console.log(`Identified ${churnRiskAccounts.length} accounts at risk of churn.`); pm.expect(responseData.data).to.be.an('array'); }); } else { console.error("Failed to retrieve customer health data or invalid response format."); }
Step 5: Build the Webhook Alert Request
Now, add a second request to your collection titled 2. Send Slack Churn Alert.
- Method: POST
- URL: {{slackWebhookUrl}}
- Headers:
- Content-Type: application/json
Before setting the body, we need to populate the alert payload dynamically. Go to the Scripts -> Pre-request tab of this Send Slack Churn Alert request and insert this script:
javascript // Retrieve flagged accounts from collection variables const rawFlagged = pm.collectionVariables.get("flaggedAccounts"); const flaggedAccounts = rawFlagged ? JSON.parse(rawFlagged) : [];
// If no accounts are at risk, skip sending the webhook if (flaggedAccounts.length === 0) { console.log("No accounts met churn risk criteria. Skipping alert."); // Execution control: stops execution of this request pm.execution.skipRequest(); }
// Build Slack Block Kit formatted message let blocks = [ { "type": "header", "text": { "type": "plain_text", "text": "?? High Churn Risk Alert Detected", "emoji": true } }, { "type": "section", "text": { "type": "mrkdwn", "text": `Found ${flaggedAccounts.length} account(s) exhibiting high-risk retention indicators:` } }, { "type": "divider" } ];
flaggedAccounts.forEach(acc => { blocks.push({ "type": "section", "text": { "type": "mrkdwn", "text": `Company: ${acc.name} (${acc.plan} Plan - $${acc.mrr}/mo)\nHealth Score: ${acc.score}/100\nUsage Drop: -${acc.drop}% this week\nAdmin Inactive: ${acc.adminInactiveDays} days` } }); });
// Set the request body dynamically pm.request.body.raw = JSON.stringify({ "blocks": blocks });
In the Body tab of the request, select raw and set the format to JSON. You can leave the body text empty or put {} because the Pre-request script dynamically overwrites pm.request.body.raw before transmission.
Webhook Alert Integrations Compared
Depending on your team's workflow tools, you can format the alert destination to land where your customer success team operates. Here is how Postman connects with top destinations:
| Alert Destination | Integration Method | Response Latency | Best Used For |
|---|---|---|---|
| Slack | Incoming Webhooks / Block Kit | Instant (less than 1s) | Real-time channel alerts for CS reps |
| Microsoft Teams | Office 365 Webhook Connector | Instant (less than 1s) | Enterprise communication workflows |
| Customer.io / HubSpot | Custom Event API | Asynchronous | Triggering automated email re-engagement flows |
| PagerDuty / Opsgenie | Alert API | Instant (less than 1s) | Urgent enterprise account intervention |
| Zapier / Make | Catch Webhook | Instant (less than 2s) | Routing flags to Google Sheets, Notion, or CRMs |
Step 6: Schedule Automated Execution with Postman Monitors
Running requests manually inside the desktop app does not protect you from weekend churn or off-hours account abandonment. You need Postman's cloud infrastructure to run the collection automatically.
How to Create a Postman Monitor:
- In the left-hand navigation pane, select your SaaS Early Churn Warning System collection.
- Click the three dots (...) menu next to the collection name and select Monitor collection.
- Configure the monitor settings:
- Monitor Name: Daily Churn Warning Monitor
- Environment: Select Production Alerts
- Run Frequency: Select Timer-based, then set it to Daily or Every 6 Hours.
- Regions: Select specific cloud regions (for example, US East or EU West) if your API enforces IP allowlists or regional restrictions.
4. Click Create Monitor.
Postman now executes your collection on cloud servers according to your exact schedule. When an account breaches your thresholds, a Slack message appears automatically without human intervention.
Advanced Churn Scoring Rules You Can Build in Postman
Single-variable triggers (like evaluating only login frequency) often create false positives. A customer might be on vacation for two weeks, causing an alert for an otherwise healthy account. Combining multiple weighted data points inside your JavaScript script creates a resilient Health Score Matrix.
Here is an advanced matrix strategy you can implement in Postman's script engine:
1. The Multi-Factor Weighted Score
Assign weights to different actions in JavaScript rather than relying solely on server-side scores:
javascript let riskPoints = 0;
// Factor 1: Billing downgrade attempt if (account.has_visited_cancellation_page) riskPoints += 45;
// Factor 2: Declining user engagement if (account.active_users_drop > 50) riskPoints += 30;
// Factor 3: Open unresolved high-severity support tickets if (account.open_urgent_tickets > 2) riskPoints += 15;
// Factor 4: Payment failure (Stripe past_due status) if (account.payment_status === 'past_due') riskPoints += 25;

if (riskPoints >= 50) { // Flag account for high-priority churn intervention }
2. Segmenting Alerts by Account Value (MRR)
Not all churn requires the same response velocity. Losing an enterprise account paying $2,000/month requires immediate human intervention, whereas losing a self-serve $19/month user is better routed to an automated email re-engagement sequence.
You can implement logical routing in your Postman script:
javascript if (account.mrr >= 1000) { // Send urgent alert to #cs-enterprise-alerts with @channel tag } else { // Route to a Zapier webhook that triggers an automated email campaign }
Common Pitfalls and Troubleshooting
When deploying API-driven churn monitoring, teams frequently run into a few edge cases. Here is how to fix them:
1. Alert Fatigue from Duplicate Notifications
If your Postman Monitor runs every 6 hours and an account stays at risk for 3 days, your Slack channel will receive notifications 12 times for the exact same customer.
The Fix: Use a lightweight state store or cache key. Modify your backend API to store an alert_sent_at timestamp on the customer object, or use Postman's pm.globals / external database endpoint (like Redis) to verify if an alert was sent within the past 7 days before firing the webhook.
2. Exceeding Postman Cloud Monitor Limits
Free Postman accounts include 1,000 monitor runs per month. Running a monitor every 5 minutes across multiple environments will quickly consume your monthly allocation.
The Fix: A daily run (30 runs per month) or an every-6-hours run (around 120 runs per month) is optimal for churn detection. Churn is a macro trend that develops over days, not seconds. If sub-minute real-time execution is required, consider deploying Postman's CLI engine, Newman, on an AWS Lambda or GitHub Actions cron pipeline.
3. API Pagination Truncation
If your database contains 5,000 accounts and your endpoint defaults to returning 50 accounts per page, a standard GET request will only check the first 1% of your customer base.
The Fix: Handle API pagination in Postman using postman.setNextRequest(). Loop through pages until next_page is null before processing the aggregated array in your evaluation script.
Running Postman Churn Alerts via CLI (Newman in CI/CD)
If you prefer keeping your monitoring infrastructure inside your existing engineering pipelines rather than Postman's cloud monitors, you can run the exact same collection using Newman, Postman's open-source command-line runner.
You can run Newman inside GitHub Actions, GitLab CI, or a scheduled cron server.
Step 1: Export Collection and Environment
Export your SaaS Early Churn Warning System collection and Production Alerts environment as JSON files (collection.json and environment.json).
Step 2: Create a GitHub Action Workflow
Create a .github/workflows/churn-alerts.yml file in your repository:
yaml name: Run Automated Churn Alerts
on: schedule:
Runs daily at 09:00 AM UTC
- cron: '0 9 *'
workflow_dispatch:
jobs: run-churn-check: runs-on: ubuntu-latest steps:
- name: Checkout Code
uses: actions/checkout@v3
- name: Install Node.js
uses: actions/setup-node@v3 with: node-version: '18'
- name: Install Newman
run: npm install -g newman
- name: Run Churn Collection
run: | newman run collection.json \ -e environment.json \ --env-var "apiToken=${{ secrets.SAAS_API_TOKEN }}" \ --env-var "slackWebhookUrl=${{ secrets.SLACK_WEBHOOK_URL }}"
This method keeps your API secrets inside GitHub Secrets while maintaining the flexibility of Postman's script engine.
The Complete SaaS Retention Workflow
Catching churn signals early is only half the battle; how your team responds determines whether you actually rescue revenue. An automated alert system functions best as part of an end-to-end retention workflow:
- Signal Detection (Postman): Cloud monitor evaluates API telemetry every morning at 8:00 AM.
- Alert Classification: High-MRR accounts trigger a Slack notification to the assigned Account Manager. Low-MRR accounts trigger an event in Customer.io or HubSpot.
- Human Outreach: The Account Manager opens the account history, identifies the specific dropped metric (such as disabled integrations), and sends a personalized, helpful check-in email.
- Automated Nudge: The low-MRR customer receives a targeted, automated email offering a 15-minute optimization call or showcasing an underutilized feature.
- Feedback Loop: If the account re-engages and their health score recovers above 50, the Postman script automatically clears them from the alert list on the next run.
By leveraging Postman to bridge your API data and team communication tools, you build an automated early-warning engine that protects MRR without requiring weeks of custom engineering.
How Saasbonus Helps You Scale Your SaaS Stack
Building lean, efficient automation stack workflows with tools like Postman, modern APIs, and webhooks allows fast-growing SaaS startups to operate with enterprise-grade operational discipline.
At Saasbonus, we specialize in cutting through marketing hype to deliver independent, hands-on software reviews, architectural breakdowns, and tool comparisons. Whether you are evaluating customer analytics engines like PostHog versus Metabase, choosing the right email automation platform, or optimizing your cloud infrastructure costs, Saasbonus provides practical playbooks to help software teams scale smartly.