Datadog vs Sentry: Best Monitoring Tool for SaaS?
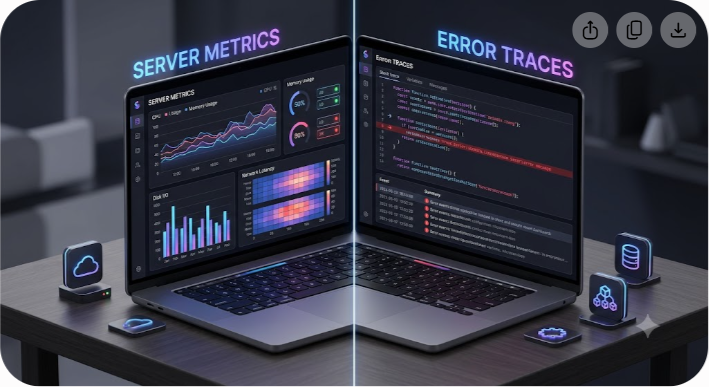
Datadog is a comprehensive infrastructure and full-stack observability platform built for enterprise scale, while Sentry is a developer-first error tracking and performance debugging engine built for actionable code fixes. Choosing between them isn't about deciding which tool is objectively better; it is about matching your monitoring layer to your team's architectural complexity and monthly burn rate.
Early-stage SaaS startups often overpay for their initial telemetry stack because they buy enterprise observability features before they even have real infrastructure to observe. When you are a team of three engineers shipping a Next.js frontend with a Node.js API hosted on Vercel and Supabase, paying for per-host agent monitoring wastes valuable capital. Conversely, once you scale to twenty microservices, distributed queues, and multi-region Kubernetes clusters, relying solely on unhandled exception alerts will leave you blind to systemic latency and cloud resource exhaustion.
At Saasbonus, we regularly analyze software stacks across early-stage startups to help founders pick the right tooling without blowing through their seed runway. Below is a complete breakdown of Datadog vs Sentry to help you determine which tool belongs in your stack today.
The Core Verdict: When to Choose Which Tool
If you want the direct answer before diving into the granular features, architecture tradeoffs, and billing traps:
- Choose Sentry if: You are an early-stage to growth-stage SaaS startup (pre-Seed to Series B) focused on shipping code fast, catching frontend or backend runtime crashes instantly, and giving developers the exact stack trace and line of code to fix issues. Sentry offers predictable usage-based pricing, a generous free tier, unlimited team seats on paid plans, and takes less than fifteen minutes to integrate.
- Choose Datadog if: You are a mid-market or enterprise engineering organization running complex server infrastructure, Kubernetes clusters, database replicas, and dozens of microservices. You need unified logs, host metrics, synthetic user journeys, cloud security, and distributed network telemetry in a single dashboard—and you have a dedicated DevOps or SRE team to manage the configuration.
- The Hybrid Strategy (What Most Mid-Stage SaaS Teams Actually Do): Pair Sentry for frontend crash reporting, client-side session replay, and developer error triage with Datadog (or an open-source log aggregator) for backend infrastructure host metrics and database telemetry.
Datadog vs Sentry: Feature Comparison Matrix
| Feature / Metric | Datadog | Sentry |
|---|---|---|
| Primary Architectural Focus | Infrastructure, APM, and Full-Stack Telemetry | Code-Level Error Tracking and APM |
| Pricing Model | Per-host ($15-$31+/mo) + per-GB logs + indexed event overages | Usage-based per event type (Errors, Transactions, Replays) |
| Seat-Based Fees | Yes (on select product suites and custom metrics) | No (Unlimited users on Team tier at $26/mo base) |
| Free Tier / Trial | 14-day free trial (Limited free tier capped at 5 hosts) | Developer Plan (1 user, 5,000 errors/month, forever free) |
| Time to First Value | Days to weeks (Agent installation, dashboard config) | 10 to 15 minutes (Install SDK, drop DSN into environment) |
| Frontend & Mobile Crash Reporting | Good (Via RUM module, billed per 1,000 sessions) | Best-in-Class (Deep source maps, ANRs, symbolication) |
| Infrastructure Monitoring | Industry Leader (Kubernetes, AWS/GCP, host metrics) | None (Does not monitor servers or network hardware) |
| Log Management | Enterprise-grade ($0.10/GB ingest + $1.70/M indexed) | Basic (Trace-connected context, not a raw log warehouse) |
| Open Source Availability | Closed Source (SaaS only) | Fair Source / Self-Hostable Edition Available |
What Is Sentry? The Developer-First Error Engine
Sentry began with a single mission: tell developers when their code breaks in production and give them everything they need to fix it immediately. Instead of making you search through millions of raw log lines to figure out why an HTTP 500 error occurred, Sentry captures the exact unhandled exception, aggregates duplicate crashes into actionable issues, and presents the entire execution context.
When a user hits a bug in your SaaS application, Sentry records:
- The exact stack trace with un-minified code (via automatic source map upload).
- Global variables, local state, and HTTP request headers.
- Breadcrumbs detailing every user click, console log, and API call preceding the crash.
- Browser, OS, device hardware details, and release commit hashes.
Over the past few years, Sentry has expanded into Application Performance Monitoring (APM), Session Replay, Continuous Profiling, and AI-assisted debugging (via Sentry Seer). However, its core design philosophy remains strictly developer-centric. It assumes your system failures manifest as code exceptions, unhandled promise rejections, or slow API response spans.
Where Sentry Outshines the Competition
- Zero-Friction Source Map & Symbolication: Setting up React, Next.js, React Native, or iOS crash reporting in Sentry is effortless. It automatically ties incoming error stack traces back to your specific GitHub or GitLab commit lines.
- Actionable Issue Triage: Sentry groups thousands of identical errors into a single issue thread. Developers can assign issues, sync them with Jira or Linear, and resolve them directly via git commit messages (`fix: resolve null check #104`).
- Usage-Based, User-Agnostic Pricing: You pay for the volume of errors, spans, and replays you consume. Adding your entire engineering team, product managers, and QA testers to the platform costs nothing extra on paid tiers.
What Is Datadog? The Enterprise Observability Empire
Datadog is a unified telemetry and security platform built to monitor everything powering a modern enterprise: physical servers, cloud instances, serverless functions, databases, network hardware, container orchestrators, applications, and end-user browsers.
Datadog operates through a lightweight host agent (the `datadog-agent`) installed directly on your EC2 instances, Kubernetes nodes, or bare-metal servers. This agent continuously streams system metrics (CPU load, memory usage, disk I/O, network throughput) back to Datadog's centralized data engine.
Datadog's product ecosystem spans dozens of modular SKUs:
- Infrastructure Monitoring: Visualizing server metrics, cloud resource usage, and process tables.
- APM & Distributed Tracing: Auto-instrumenting application code to trace requests across microservices.
- Log Management: Centralizing, parsing, and searching high-volume application and system logs.
- Real User Monitoring (RUM) & Synthetic Testing: Tracking client-side user sessions and simulating automated browser tests.
- Cloud Security & Network Performance: Auditing compliance, runtime threats, and VPC flow logs.

Datadog's strength lies in correlation. When an alert fires for degraded checkout latency, a developer can jump seamlessly from an APM trace to the underlying Kubernetes node CPU spike, and then to the exact database log line generated at that millisecond.
Where Datadog Outshines the Competition
- Comprehensive Infrastructure Visibility: If your backend spans dozens of microservices on AWS or Kubernetes, Datadog's pre-built integration ecosystem (over 600 connectors) is unmatched.
- Deep Distributed Tracing: Datadog automatically maps complex service-to-service dependency graphs, showing you exactly which microservice or database query is bottlenecking p99 latency.
- Custom Dashboards & Alerting: You can build multi-variable dashboards combining infrastructure metrics, business KPIs, and system logs with advanced statistical anomaly detection.
Deep-Dive Feature Breakdown
To make an informed decision for your SaaS startup, you need to understand how these two platforms compare across critical operational categories.
1. Error Tracking and Crash Reporting
Winner: Sentry
While Datadog offers error tracking as a subset of its APM and RUM modules, Sentry remains the top platform for error reporting.
Datadog treats errors primarily as numerical metrics (error rates per second) attached to APM traces or log records. Inspecting an error in Datadog often feels like navigating a dense telemetry database.
Sentry, by contrast, is built entirely around developer workflow. It aggregates identical stack traces, filters out browser extension noise automatically, and tracks error regression across releases. If a bug was marked resolved in v1.2.0 but resurfaces in v1.4.0, Sentry automatically reopens the issue and alerts the engineer who touched that code path.
2. Application Performance Monitoring (APM) & Tracing
Winner: Datadog (for complex backends) / Sentry (for simple full-stack)
Datadog APM provides deep, bytecode-level auto-instrumentation across backend languages (Java, Go, Python, Node.js, .NET, Ruby). It renders comprehensive service maps, flame graphs, and distributed tracing spans across complex microservice architectures with zero code modifications needed in many runtimes.
Sentry Performance monitoring uses span-based tracing to track request flows from the client browser down through backend API routes and SQL queries. For a typical monolithic or lightweight microservice SaaS (e.g., a Next.js app calling a PostgreSQL database), Sentry APM gives you 90% of what you need without setting up complex host agents. However, for deep distributed backend debugging across hundreds of services, Datadog provides superior telemetry density.
3. Infrastructure and Cloud Resource Monitoring
Winner: Datadog
Sentry does not attempt to monitor infrastructure. Sentry has no native concept of server CPU utilization, memory pressure, Kubernetes pod restarts, disk I/O bottlenecks, or network packet drops.
If your SaaS startup runs bare metal, EC2 instances, self-hosted Redis/PostgreSQL clusters, or Kubernetes, you cannot use Sentry to monitor server health. You will need a dedicated infrastructure tool like Datadog, Prometheus/Grafana, or AWS CloudWatch.
4. Log Management
Winner: Datadog
Datadog includes an enterprise-grade log management engine capable of ingesting terabytes of raw logs daily. It features live tailing, automated log parsing, faceted search, PII masking, and seamless log-to-trace linking.
Sentry does not serve as a traditional log aggregator. While Sentry allows you to attach custom breadcrumbs and log context to error reports, it is not designed for storing or querying general application stdout/stderr logs. If you need a searchable repository of every HTTP request log or system event, Sentry is not the right tool.
The Cost Reality: Sentry Pricing vs Datadog Pricing
Pricing structure is where early-stage startups get caught off guard. The two vendors utilize completely different billing philosophies that impact your monthly burn rate as you scale.
Sentry Pricing Model: Predictable Usage
Sentry bills based on the volume of events ingested across four distinct categories: Errors, Performance Transactions, Session Replays, and Attachments.
- Developer Tier: Free forever. Includes 1 user, 5,000 errors/month, 10,000 performance units, and 50 replays.
- Team Tier: Starts at $26/month (billed monthly) or $20/month (billed annually). Includes unlimited team members, 50,000 errors/month, 100,000 performance units, and 500 replays.
- Business Tier: Starts at $80/month. Adds advanced insights, cross-project visibility, custom dashboards, and 90-day retention.
If your startup experiences a sudden spike in errors (e.g., a broken deployment firing 100,000 exceptions overnight), Sentry lets you set rate limits and spike protection controls. Once your monthly quota is exhausted, Sentry simply drops incoming events until the next billing cycle or until you purchase additional volume blocks. Your bill stays predictable unless you explicitly enable pay-as-you-go overages.

Datadog Pricing Model: Modular Multi-SKU Surcharges
Datadog uses a modular, per-host plus usage-based pricing model. This is where startups encounter unexpected costs.
Key Datadog line items include:
- Infrastructure Monitoring: Starts at $15 per host/month (billed annually) or $18/month (pay-as-you-go).
- APM & Distributed Tracing: Starts at $31 per host/month (annual) or $36/month (pay-as-you-go). Bundles 150 GB span ingestion per host.
- Log Management: $0.10 per ingested GB, PLUS $1.70 per million indexed log events (15-day retention).
- Real User Monitoring (RUM): $1.80 per 1,000 active sessions.
- Custom Metrics: $5.00 per 100 custom metrics per month (beyond the 100 included per host).
Datadog Billing Patterns to Watch
- The High-Water Mark Calculation: Datadog infrastructure billing is calculated using your 99th percentile peak host usage during the month. If your autoscaling group briefly scales from 5 instances to 50 instances for two hours during a traffic spike, Datadog may bill you for 50 hosts for the entire month.
- Custom Metrics Surprises: In Datadog, any metric sent with unique key-value tags increases your custom metric count. If a developer accidentally logs an API metric with a unique `user_id` tag (high cardinality), you can generate 10,000 custom metrics overnight—costing hundreds of dollars in automated overage fees.
- Double Log Ingestion and Indexing Fees: Datadog charges once to ingest raw log data ($0.10/GB) and charges a second time to make those logs searchable and indexed ($1.70 per million events).
Common Startup Mistakes When Building an Observability Stack
SaaS founders often make repeatable mistakes when setting up their monitoring tools. Here are three major pitfalls to avoid:
1. Buying Datadog Before Achieving Product-Market Fit
Installing Datadog on a seed-stage application with 100 daily active users is like buying an enterprise ERP system to manage a small storefront. You pay $100-$300/month for features you do not need, while spending engineering hours configuring agents and alert rules instead of talking to users.
2. Relying on Sentry for Server Health
Sentry tells you if your Node.js application crashes due to an unhandled promise rejection, but it will not warn you if your EC2 instance runs out of disk space or if your PostgreSQL database memory hits 99% capacity. Do not assume that zero Sentry alerts means your production infrastructure is healthy.
3. Leaving Debug Telemetry Enabled in Production
Logging every verbose debug line or capturing 100% of APM traces in production will inflate your bill dramatically. Always configure sampling rates in production:
- Sample 100% of errors (exceptions should always be captured).
- Sample 5% to 10% of successful HTTP performance transactions.
- Configure log sampling rules to discard noisy health-check logs (`GET /healthz 200`).
How to Transition Your Monitoring Stack as You Scale
Your observability needs will evolve as your startup progresses through funding rounds and customer scale. Here is a practical path for growing your monitoring architecture:
Stage 1: Pre-Seed to Seed (0 to 1,000 Users)
- Primary Error & APM Tool: Sentry (Developer or Team tier, $0 to $26/mo).
- Infrastructure Metrics: Built-in cloud provider dashboards (AWS CloudWatch basic metrics, Vercel Analytics, or Render Metrics - free).
- Log Management: Basic cloud provider log tailing or simple stdout logs.
- Total Monthly Spend: $0 to $30/month.
Stage 2: Series A Growth (1,000 to 50,000 Users)
- Frontend & Error Tracking: Sentry Business Plan ($80/mo) for crash reporting, source map triage, and client session replays.
- Backend Infrastructure & APM: Dedicated lightweight log/metric aggregator (or entry-level Datadog Infrastructure plan for core backend nodes).
- Total Monthly Spend: $150 to $500/month.
Stage 3: Series B+ Enterprise Scale (50,000+ Users)
- Full-Stack Observability: Complete Datadog deployment across all Kubernetes clusters, databases, and microservices for platform and SRE teams.
- Developer Workflow: Retain Sentry integrated into GitHub/Linear specifically for frontend, mobile, and client-side error triage.
- Total Monthly Spend: $1,500+/month.
Final Decision Framework: Which Should You Install Today?
To pick the right tool for your SaaS startup right now, ask yourself these three practical questions:
- What is keeping you awake at night?
- If you're worried that a new production release broke the frontend signup button or an API endpoint without your knowledge, install Sentry.
- If you're worried about cloud server memory leaks, database connection pool exhaustion, or microservice network latency, install Datadog.
- Who will own the tool day-to-day?
- If your core team consists of full-stack product engineers who spend their time in code editors, Sentry fits into their daily git commit workflow.
- If you have dedicated DevOps, Platform, or SRE engineers responsible for cloud infrastructure health, Datadog provides the multi-layered telemetry they require.
- What is your strict monthly budget?
- If you need fixed, capped, predictable software costs under $100/month, Sentry is the clear choice.
- If you have an established venture burn rate and require enterprise compliance and single-pane-of-glass infrastructure visibility, Datadog is worth the investment.
For more software comparisons, startup discount breakdowns, and tool stack recommendations, explore our full library of reviews on Saasbonus.