How to Benchmark LLM Latency for Production SaaS
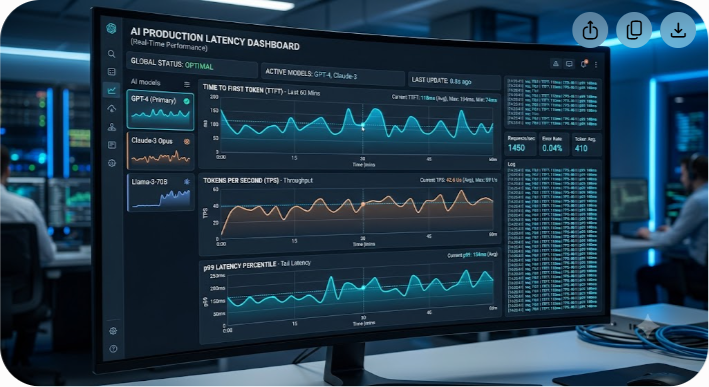
Measuring large language model performance by averaging total API response times is the fastest way to hide severe user experience degradation in production SaaS applications. If a user waits six seconds for a complete 500-token completion, that single metric tells you almost nothing about whether your interface feels responsive or agonizingly broken.
To build fast, scalable AI features, engineering teams must decouple token delivery into granular micro-metrics: Time to First Token (TTFT), Inter-Token Latency (ITL), and Tokens Per Second (TPS). This guide walks you through the exact technical framework required to benchmark LLM latency, run synthetic load tests under high concurrency, isolate provider bottlenecks, and establish continuous monitoring for production systems.
Why Standard API Benchmarking Fails for Large Language Models
Traditional REST and GraphQL endpoints exhibit static response profiles. A database query or microservice payload arrives as a single, discrete HTTP response. Standard HTTP benchmarking utilities like ApacheBench (`ab`) or basic `curl` loops measure total Round Trip Time (RTT), allowing developers to establish clear p50, p95, and p99 percentiles.
Large Language Models operate on autoregressive generation. Because tokens emerge sequentially over an open HTTP connection (typically via Server-Sent Events or WebSockets), measuring total completion time obscures the true bottlenecks. An application streaming text at 40 tokens per second with a 200-millisecond initial delay creates an instantly responsive interface. Conversely, an API that takes four seconds to output its first token before dumping the remaining payload in 100 milliseconds yields an identical total RTT—yet leaves end users staring at a frozen UI, assuming the application crashed.
To capture true performance in production SaaS, engineering teams must categorize latency into two primary operational phases:
- Prefill Latency (TTFT): The compute phase where the LLM processes prompt context tokens in parallel to generate the initial key-value (KV) cache and emit the first token.
- Generation Latency (ITL * Output Tokens): The sequential compute phase where model weights execute repeatedly over open streaming connections to predict every subsequent token.
Evaluating vendor SLAs or self-hosted inference engines using raw average latency obscures tail latency spikes caused by queue saturation, KV cache eviction, and variable prompt lengths. Effective LLM benchmarking requires granular metrics tailored specifically to token streaming architecture.
Key Metrics Every SaaS Engineering Team Must Track
To build actionable performance dashboards, track five core latency and throughput metrics.
| Metric Name | Unit | What It Measures | Target Production Range |
|---|---|---|---|
| Time to First Token (TTFT) | Milliseconds (ms) | Time elapsed between firing the HTTP request and receiving token #1. | 150 ms – 400 ms |
| Inter-Token Latency (ITL) | Milliseconds (ms) | Average time gap between receiving consecutive tokens during streaming. | 15 ms – 35 ms |
| Tokens Per Second (TPS) | Tokens / second | Rate of generation per single user request (1000 / ITL). | 30 – 80 TPS |
| System Throughput | Total Tokens / sec | Combined generation rate across all concurrent active requests. | Scaling with hardware/concurrency |
| Time Per Output Token (TPOT) | Milliseconds (ms) | Average generation time per token excluding the prefill phase. | 12 ms – 25 ms |
Time to First Token (TTFT)
TTFT represents perceived speed. It incorporates DNS resolution, TLS handshakes, network transit, API routing queues, and the model prefill phase. In SaaS applications utilizing streaming UI components, a low TTFT (<300 ms) engages users immediately, giving the perception of instant intelligence even if total generation takes several seconds.
Inter-Token Latency (ITL) and Tokens Per Second (TPS)
ITL measures reading comfort. Human reading speed averages approximately 250 to 300 words per minute, translating to roughly 6 to 8 tokens per second. While a TPS of 15 is technically faster than human reading speed, low ITL (high TPS) becomes critical for background agentic execution, code generation, complex data extraction, and dynamic multi-step workflows where upstream processing blocks downstream execution.
Tail Latency: p95 and p99 Percentiles
Average metrics lie. If your median (p50) TTFT is 250 milliseconds, but your 99th percentile (p99) climbs to 4,500 milliseconds, one out of every 100 requests results in a broken user experience. In multi-tenant enterprise SaaS systems serving thousands of requests per minute, a p99 degradation affects high-volume accounts continuously. Benchmark distributions, not single numbers.
Designing Realistic Benchmarks for SaaS Workflows
Synthetic benchmarks like HumanEval or MMLU measure model intelligence, not production latency. Running a script that sends fixed 10-token prompts to an endpoint yields artificially pristine numbers that collapse under actual SaaS usage. To build a valid benchmarking test suite, construct workloads that mirror your production traffic profile.
1. Match Your Prompt Context Distributions
LLM prefill time scales directly with context length. A model processing an 8,000-token retrieval-augmented generation (RAG) context payload requires significantly more compute for its prefill pass than a simple 50-token classification prompt.
- Agentic Workflows: High input context (4,000–32,000 tokens), low output length (100–300 tokens). Focus heavily on TTFT and prompt caching efficiency.
- Code Generation: Moderate input context (1,000–4,000 tokens), high output length (500–2,000 tokens). Focus heavily on TPS and ITL stability.
- Conversational AI: Low-to-moderate input context (500–2,000 tokens), moderate output length (150–400 tokens). Balanced focus on TTFT and reading-speed TPS.
2. Isolate System Prompt, Context, and Generation Tokens
When building load testing scripts, structure dynamic payloads that vary input and output lengths independently. If you keep input lengths fixed at 500 tokens while measuring performance, you will fail to detect prefill compute saturation when users submit large enterprise documents.
3. Test Under Realistic Concurrency Spikes

Inference engines like vLLM, TensorRT-LLM, and TGI rely on continuous batching to maximize GPU utilization. As concurrency increases, the engine packs multiple user requests into single forward passes. This increases total GPU throughput, but individually degrades Inter-Token Latency for existing streams. Benchmarks must test concurrency ramps from 1 to 500+ virtual users to identify the exact tipping point where individual request latency breaches target SLAs.
Step-by-Step: Setting Up a Custom Python Latency Benchmarker
While off-the-shelf tools exist, building a lightweight, custom Python benchmarker using `httpx` or `aiohttp` allows you to intercept Server-Sent Events (SSE) and log timestamped token arrival metrics directly into your analytical stack.
Here is a production-grade asynchronous benchmarking script designed to measure TTFT, ITL, total completion time, and output token counts for OpenAI-compatible streaming endpoints:
```python import asyncio import time import json import statistics import httpx
Configuration
API_URL = "https://api.openai.com/v1/chat/completions" # Or local vLLM/TGI endpoint API_KEY = "your-api-key-here" MODEL_NAME = "gpt-4o-mini" # Or local model name
PROMPT = "Explain the architectural differences between event-driven microservices and monolithic systems in enterprise SaaS."
async def measure_streaming_latency(client, request_id): headers = { "Authorization": f"Bearer {API_KEY}", "Content-Type": "application/json" } payload = { "model": MODEL_NAME, "messages": [{"role": "user", "content": PROMPT}], "stream": True, "max_tokens": 300, "temperature": 0.2 }
start_time = time.perf_counter() first_token_time = None token_timestamps = [] output_text = ""
try: async with client.stream("POST", API_URL, headers=headers, json=payload, timeout=60.0) as response: if response.status_code != 200: print(f"[Req {request_id}] Failed with status: {response.status_code}") return None
async for line in response.aiter_lines(): current_time = time.perf_counter() if line.startswith("data: ") and line != "data: [DONE]": data_str = line[6:] try: data = json.loads(data_str) delta = data["choices"][0]["delta"] content = delta.get("content", "")
if content: if first_token_time is None: first_token_time = current_time token_timestamps.append(current_time) output_text += content except json.JSONDecodeError: continue
end_time = time.perf_counter()
if not token_timestamps: return None
ttft = (first_token_time - start_time) * 1000 # Convert to ms total_time = end_time - start_time total_tokens = len(token_timestamps)
Calculate Inter-Token Latencies
itls = [] for i in range(1, len(token_timestamps)): itls.append((token_timestamps[i] - token_timestamps[i-1]) * 1000)
avg_itl = statistics.mean(itls) if itls else 0 tps = total_tokens / (end_time - first_token_time) if end_time > first_token_time else 0
return { "request_id": request_id, "ttft_ms": ttft, "avg_itl_ms": avg_itl, "total_time_s": total_time, "total_tokens": total_tokens, "tps": tps }
except Exception as e: print(f"[Req {request_id}] Exception occurred: {str(e)}") return None
async def run_benchmark(concurrency=10): async with httpx.AsyncClient() as client: tasks = [measure_streaming_latency(client, i) for i in range(concurrency)] results = await asyncio.gather(*tasks)
valid_results = [r for r in results if r is not None]
ttfts = [r["ttft_ms"] for r in valid_results] tps_list = [r["tps"] for r in valid_results] itls = [r["avg_itl_ms"] for r in valid_results if r["avg_itl_ms"] > 0]
print("\n=== BENCHMARK RESULTS ===") print(f"Successful Requests: {len(valid_results)} / {concurrency}") print(f"TTFT (p50): {statistics.median(ttfts):.2f} ms") print(f"TTFT (p95): {quantile(ttfts, 0.95):.2f} ms") print(f"Average TPS: {statistics.mean(tps_list):.2f} tokens/sec") print(f"Average ITL: {statistics.mean(itls):.2f} ms")
def quantile(data, q): sorted_data = sorted(data) pos = q (len(sorted_data) - 1) base = int(pos) rest = pos - base if base + 1 < len(sorted_data): return sorted_data[base] + rest (sorted_data[base + 1] - sorted_data[base]) return sorted_data[base]
if __name__ == "__main__": asyncio.run(run_benchmark(concurrency=20)) ```
Script Execution and Analysis
When running this script, observe how `ttft_ms` increases as you ramp `concurrency` from 1 to 50. If `ttft_ms` climbs sharply while `avg_itl_ms` remains stable, your system is bottlenecked by the API provider's request routing queue or prompt prefill limits. If `avg_itl_ms` spikes under load, the underlying GPU memory bandwidth is saturated by continuous batching overhead.
Utilizing Production Load Testing Tools: Locust and Guidance
While custom scripts work well for quick point-in-time checks, enterprise SaaS teams require full load-testing frameworks capable of generating distributed traffic, simulating network latency variations, and exporting metrics to Prometheus or Datadog.
Locust for Distributed SSE Load Testing
Locust allows you to write Python test scenarios and scale them across distributed worker nodes to simulate hundreds of concurrent users.
```python from locust import HttpUser, task, between import json import time
class LLMUser(HttpUser): wait_time = between(1, 3)
@task def generate_completion(self): headers = {"Authorization": "Bearer YOUR_API_KEY", "Content-Type": "application/json"} payload = { "model": "vllm-llama3-70b", "messages": [{"role": "user", "content": "Generate an enterprise billing audit plan."}], "stream": True, "max_tokens": 200 }
start_time = time.perf_counter() first_token_logged = False
with self.client.post("/v1/chat/completions", json=payload, headers=headers, stream=True, catch_response=True) as response: if response.status_code != 200: response.failure(f"HTTP {response.status_code}") return

for line in response.iter_lines(): if line: if not first_token_logged: ttft = (time.perf_counter() - start_time) * 1000 self.environment.events.request.fire( request_type="SSE", name="LLM_TTFT", response_time=ttft, response_length=0, exception=None, ) first_token_logged = True
total_duration = (time.perf_counter() - start_time) * 1000 self.environment.events.request.fire( request_type="SSE", name="LLM_Total_Completion", response_time=total_duration, response_length=0, exception=None, ) ```
By decoupling metric names (`LLM_TTFT` vs. `LLM_Total_Completion`), Locust surfaces percentile graphs specifically isolating prompt processing time from downstream streaming duration.
Managed APIs vs. Self-Hosted Inference: Performance Benchmarks
A common architectural crossroad for growing SaaS platforms is deciding whether to rely on managed API providers (OpenAI, Anthropic, Together AI, Anyscale, Groq) or self-host open models (Llama 3, Mistral) using engines like vLLM or TensorRT-LLM on dedicated GPU cloud infrastructure (AWS EC2, Modal, RunPod).
Benchmarking Managed API Gateways
Managed APIs eliminate GPU infrastructure management, but introduce unmanaged latency variables:
- Noisy Neighbor Multi-Tenancy: Managed providers dynamically partition hardware. You may observe TTFT fluctuations of up to 400% depending on time of day.
- Geographic Gateway Routing: Requests to proprietary endpoints often route through global load balancers before hitting actual GPU clusters, adding fixed network overhead.
- Cold Starts & Tiering: Enterprise tiers typically grant dedicated capacity, yielding dramatically better p99 stability than public pay-as-you-go developer tiers.
Benchmarking Self-Hosted Inference (vLLM / TensorRT-LLM)
Self-hosting gives you full control over batch size, tensor parallelism, and KV cache allocation. Key serving mechanisms include:
- PagedAttention Allocation: Manages virtual GPU memory to eliminate memory fragmentation in the KV cache.
- Continuous Batching: Dynamically packs arriving incoming requests into ongoing GPU execution passes.
- Chunked Prefill: Splits large prompt prefill compute into manageable chunks, preventing long prompts from starving active token generation streams.
When benchmarking vLLM or TensorRT-LLM endpoints, tune these three parameters deliberately. Setting concurrency limits too high degrades ITL due to memory bandwidth limits, while setting them too low forces requests into system queue buffers, driving up TTFT.
Architectural Latency Trade-Offs: Caching, Quantization, and Speculative Decoding
If your benchmarking suite reveals unacceptable TTFT or TPS numbers, applying targeted architectural optimizations yields substantial speedups:
- Prompt Caching: Lowers TTFT by storing static prompt segments in GPU memory, bypassing prefill compute on repeat contexts.
- Weight Quantization (FP8/INT4): Increases TPS by reducing the byte footprint transferred per token pass across memory buses.
- Speculative Decoding: Increases TPS by employing a small draft model to generate candidate tokens quickly for parallel verification by the target model.
1. Prompt Caching
Modern providers (including Anthropic and OpenAI) and self-hosted frameworks (vLLM) allow static prompt segments—such as massive enterprise system prompts or long PDF contexts—to be cached in GPU memory.
- Latency Impact: Drops TTFT by up to 80–90% on long-context requests.
- Benchmarking Strategy: Always test scenarios with cold cache versus warm cache to verify that your system prompt structures correctly trigger provider cache hits.
2. Weight Quantization (FP16 vs. FP8 vs. INT4)
Running large models in full precision (FP16) requires immense GPU memory bandwidth. Quantizing weights to FP8 or INT4 reduces the byte footprint transferred per token pass.
- Latency Impact: Increases generation throughput (TPS) by 1.5x to 2.5x on memory-bound workloads.
- Trade-off: Minimal accuracy loss depending on evaluation benchmarks (e.g., GSM8K, MMLU). Always pair quantization latency tests with domain-specific accuracy evaluations.
3. Speculative Decoding
Speculative decoding uses a lightweight draft model (e.g., Llama-3-8B) to generate multiple candidate tokens rapidly, which are then validated in a single parallel forward pass by a larger target model (e.g., Llama-3-70B).
- Latency Impact: Improves generation TPS by 2x to 3x without degrading target model output quality.
- Trade-off: Increases total compute overhead and energy consumption per request.
Common Pitfalls in LLM Latency Benchmarking
Even experienced software engineers frequently make critical mistakes when measuring LLM performance. Avoid these five anti-patterns:
- Benchmarking Without Disabling Local Network Buffering: When measuring streaming responses, HTTP clients, reverse proxies (like Nginx), or API gateways frequently buffer incoming TCP streams until a specific byte threshold is met. If Nginx buffers 4KB of SSE data before sending it to your client, your benchmark will register an artificially inflated TTFT, even though the LLM generated token #1 instantly. Always ensure proxies configure `proxy_buffering off;` and HTTP clients read raw socket chunks without line-level internal buffering.
- Ignoring Warm-Up Runs: Self-hosted engines and cloud API gateways experience initialization latency. First-request overhead includes loading CUDA kernels, initializing memory pools, establishing TLS sessions, and populating model weights into fast GPU VRAM. Always run 10–20 warm-up requests prior to recording baseline benchmarking figures.
- Relying on System Clock Time Instead of High-Resolution Timers: Using standard Python `time.time()` yields precision errors depending on host OS tick rates. Always use high-resolution monotonic timers like `time.perf_counter()` in Python or `performance.now()` in JavaScript to measure sub-millisecond network delta events accurately.
- Overlooking Tokenizer Discrepancies: Comparing TPS between two different model families without accounting for tokenization efficiency creates skewed benchmarks. For example, OpenAI's `o1` and `gpt-4o` tokenizers compress code and non-English text differently than older Llama tokenizers. Model A might output 30 tokens per second while Model B outputs 40 tokens per second, but if Model A packs twice as much character content into a single token, Model A is delivering actual text faster to the user. Always measure Characters Per Second (CPS) alongside Tokens Per Second when making cross-family architectural comparisons.
- Running Tests from a Single Local Machine: Executing load tests from your local development laptop over Wi-Fi introduces local CPU scheduling, local network congestion, and ISP routing variance into your benchmark metrics. Always deploy headless load-testing containers within the same cloud datacenter region (e.g., AWS `us-east-1`) as your application backend or LLM API host to isolate pure model latency from consumer internet overhead.
Implementing Real-Time Production Monitoring and Telemetry
Benchmarking should not remain an isolated, pre-deployment exercise. Continuous real-time observability ensures that API performance regressions, silent provider degradation, and traffic anomalies trigger immediate alerts.
To establish comprehensive observability, pass requests along a structured telemetry pipeline:
- User Application: Initiates the streaming request and attaches request-level trace identifiers.
- OpenTelemetry Span: Captures execution metrics like `ttft_ms`, `tps`, and total token counts during the live connection.
- Telemetry Collector: Aggregates span data asynchronously from backend services without blocking network paths.
- Monitoring Platform (Grafana/Datadog): Visualizes metric distributions, evaluates provider SLAs, and triggers p99 alert hooks.
Essential OpenTelemetry Span Attributes for LLM Calls
Every outbound LLM call within your microservice architecture should emit custom span attributes capturing performance and operational data:
```json { "attributes": { "llm.vendor": "vllm-self-hosted", "llm.model": "meta-llama/Meta-Llama-3-70B-Instruct", "llm.request.prompt_tokens": 1420, "llm.request.max_tokens": 250, "llm.response.completion_tokens": 185, "llm.latency.ttft_ms": 210.4, "llm.latency.itl_avg_ms": 18.2, "llm.latency.tps": 54.9, "llm.status.cache_hit": true } } ```
Setting Up Production Latency Alerts
Establish automated alerting thresholds based on moving 15-minute percentile windows:
- Critical TTFT Alert: Fire an alert if `p95(llm.latency.ttft_ms) > 1200ms` over a 15-minute window. Indicates backend API queue congestion or provider outage.
- Degraded Generation Alert: Fire an alert if `p50(llm.latency.tps) < 20` tokens/sec over a 15-minute window. Indicates GPU memory bandwidth saturation or host degradation.
- Cache Miss Anomaly Alert: Fire a warning if system prompt cache hit rates drop below 75%, signaling prompt template drift or cache eviction issues.
How Saasbonus Helps Engineers Select the Right AI Infrastructure
Benchmarking LLM latency is only half the battle—the ultimate goal is selecting the optimal infrastructure stack that balances performance, cost, and reliability for your product's unique scale.
At Saasbonus, we publish independent, hands-on architectural evaluations and cost breakdowns of modern SaaS infrastructure tools. Whether you are choosing between high-performance inference platforms like Together AI vs. Anyscale, evaluating managed vector databases for RAG workflows at scale, or optimizing your usage-based billing infrastructure as API costs grow, Saasbonus provides clear, data-driven comparisons to help software engineering teams pick the right platform the first time.