Postgres vs ClickHouse: SaaS Product Analytics Guide
The Core Verdict: When Postgres Fails and ClickHouse Wins
If your SaaS application handles fewer than 10 million event rows per month, PostgreSQL is entirely sufficient for customer-facing and internal product analytics. It simplifies your infrastructure stack, lets you join application tables directly with event logs, and avoids the operational complexity of managing a separate data engine.
However, once your event log crosses 50 million to 100 million rows, Postgres hits an architectural wall. Analytical queries requiring full table scans, high-cardinality aggregations (like unique active users), and arbitrary time-series filtering will slow down from 200 milliseconds to tens of seconds. At this scale, ClickHouse becomes indispensable.
ClickHouse is a columnar, Distributed OLAP (Online Analytical Processing) database designed to process billions of event rows per second per core. By storing data vertically by column rather than horizontally by row, ClickHouse compresses raw event logs by 70% to 90% and executes analytical queries up to 100x to 1,000x faster than PostgreSQL.
The short rule of thumb for engineering teams: Start with Postgres to launch fast; migrate your event store to ClickHouse when analytical query latencies degrade your app's user experience.
Understanding the Core Architectural Divergence: OLTP vs OLAP
To understand why Postgres and ClickHouse perform so differently under product analytics workloads, you must look at how each database engine structures and reads data on disk.
PostgreSQL: Row-Oriented Engine (OLTP)
Postgres stores data in 8KB disk pages organized by rows. When a user logs in, updates their profile, or creates a workspace, Postgres writes or updates an entire row containing every field associated with that record.
- Strengths: Rapid single-row lookups, strong ACID transactions, strict relational constraints, and instant primary-key writes.
- Weaknesses in Analytics: If you want to compute the average session duration over 20 million events using `SELECT AVG(duration) FROM user_events`, Postgres must read every single 8KB page off disk, loading unneeded columns like `user_id`, `device_metadata`, `ip_address`, and `payload` into memory.
As your event log grows into tens of gigabytes, memory bandwidth becomes the primary bottleneck, forcing Postgres to rely heavily on disk I/O.
ClickHouse: Column-Oriented Engine (OLAP)
ClickHouse stores data organized by columns. Every column is kept in a separate file or continuous disk block, compressed using algorithms specifically tailored to that column's data type (such as LZ4, ZSTD, Delta, or DoubleDelta).
- Strengths: When executing `SELECT AVG(duration) FROM user_events`, ClickHouse reads only the specific disk file containing the `duration` column. It completely skips every other attribute in the table.
- Weaknesses in Analytics: ClickHouse does not support traditional transactional updates or deletes. Updating an individual record requires heavy asynchronous background mutations.
Because analytical queries typically touch 5% to 10% of table columns across 100% of rows, ClickHouse reduces the volume of data read from disk by 90% or more compared to Postgres.
Side-by-Side Architectural Comparison
| Feature | PostgreSQL | ClickHouse |
|---|---|---|
| Primary Architecture | Row-Oriented (OLTP) | Column-Oriented (OLAP) |
| Optimal Data Scale | Less than 100GB active dataset | Terabytes to Petabytes |
| Write Pattern | Point inserts, updates, deletes | High-throughput batch inserts |
| Query Latency (100M rows) | 5 to 45 seconds | 10 to 150 milliseconds |
| Data Compression | Minimal (TOAST for large text) | 4x to 10x columnar compression |
| JOIN Capabilities | Full support (Hash, Nested Loop, Merge) | Memory-intensive, optimized for star/snowflake schemas |
| Transactions (ACID) | Full ACID support | Non-ACID, eventual consistency |
| JSON Support | Native `jsonb` with GIN indexing | Native JSON type, flattened sub-columns |
| Secondary Indexes | B-Tree, GIN, GiST, BRIN | Primary sparse indexes, Data Skipping Indexes |
Deep Dive: Scaling Product Analytics in PostgreSQL
Many SaaS teams build their initial product analytics inside Postgres because it is already running in their production stack. Doing this eliminates the cost and complexity of setting up new ETL pipelines or secondary database clusters.
```sql -- Typical schema for tracking events in Postgres CREATE TABLE product_events ( id UUID PRIMARY KEY DEFAULT gen_random_uuid(), workspace_id UUID NOT NULL, user_id UUID NOT NULL, event_name VARCHAR(64) NOT NULL, properties JSONB NOT NULL DEFAULT '{}', created_at TIMESTAMPTZ NOT NULL DEFAULT NOW() );
CREATE INDEX idx_events_workspace_created ON product_events (workspace_id, created_at DESC); ```
Where Postgres Excelled Early On
In the early stages of a SaaS product, Postgres provides several key advantages:
- Direct Application Relational Joins: You can join `product_events` directly with `users`, `subscriptions`, and `workspaces` in a single query to build filtered customer-facing dashboards.
- Flexible Metadata in `jsonb`: Tracking custom parameters (`properties->>'feature_flag'`) requires no schema migrations.
- Zero Data Pipeline Lag: Events written to Postgres are immediately readable by reporting queries without ingestion delays.
The Failure Point: How Postgres Breaks Under Scale
As event volume increases, three main bottlenecks emerge:
1. High-Cardinality `COUNT(DISTINCT)` Scans
To calculate Monthly Active Users (MAU) or unique conversion funnels, Postgres must maintain a hash table of every distinct ID encountered. For 50 million rows, a query like this forces Postgres to swap memory to disk:
```sql SELECT DATE_TRUNC('day', created_at), COUNT(DISTINCT user_id) FROM product_events WHERE workspace_id = 'c13b28ab-6e69-42b7-86f3-4d4b14d23d81' GROUP BY 1; ```
2. Index Bloat and Memory Pressure
As you add B-Tree indexes on `workspace_id`, `event_name`, and `created_at` to speed up queries, your indexes will eventually outgrow your available RAM (Buffer Pool). When indexes no longer fit in memory, every new write forces expensive random disk reads and writes.

3. Vacuum Overhead and Table Bloat
If your analytics workload includes deleting old events or updating existing records, Postgres creates dead tuples. Autovacuum processes will compete directly with incoming analytical queries for disk I/O, driving up latency spikes on production application databases.
How to Extend Postgres Lifespan Before Migrating
If you want to keep your analytics in Postgres as long as possible, implement these three optimizations:
- Declarative Table Partitioning: Partition your `product_events` table by range on `created_at` (e.g., monthly partitions). This allows Postgres to prune unneeded partitions during queries and drop old data instantly using `DROP TABLE` instead of heavy `DELETE` operations.
- BRIN (Block Range Indexes): Replace standard B-Tree indexes on time-series columns with BRIN indexes. A BRIN index stores the minimum and maximum values for a block of pages, taking up less than 1% of the space required by a standard B-Tree index.
- Hyperfunctions via TimescaleDB: Installing the TimescaleDB extension converts standard Postgres tables into hypertables, adding automatic time-partitioning, columnar compression for historical data, and continuous aggregate views.
Deep Dive: Scaling Product Analytics with ClickHouse
ClickHouse was engineered specifically to solve the scalability limits that ruin traditional row stores like Postgres when processing billions of events.
```sql -- Typical schema for tracking events in ClickHouse CREATE TABLE product_events ( workspace_id UUID, user_id UUID, event_name LowCardinality(String), properties JSON, created_at DateTime64(3, 'UTC') ) ENGINE = MergeTree() PRIMARY KEY (workspace_id, event_name) ORDER BY (workspace_id, event_name, created_at); ```
Key Architectural Features of ClickHouse
1. The MergeTree Engine and Sparse Primary Indexes
Unlike Postgres, which uses dense B-Tree indexes pointing to every individual row, ClickHouse uses sparse indexes. It writes data sorted by the `ORDER BY` key in blocks called data parts (typically 8,192 rows per index mark).
The index only stores the value of the primary key for every 8,192nd row. This keeps the index small enough to fit entirely in memory, even when indexing trillions of rows.
In practice, Mark 0 points to rows 0 through 8191 for Workspace A clicks, Mark 1 points to rows 8192 through 16383 for Workspace A views, and Mark 2 points to rows 16384 through 24575 for Workspace B clicks. The query engine reads only the specific data blocks identified by these marks.
2. Vectorized Query Execution
ClickHouse takes full advantage of modern CPU instruction sets (AVX-2 and AVX-512). Instead of processing queries one row at a time, ClickHouse processes data in SIMD (Single Instruction, Multiple Data) vectors. Operations like sums, counts, and string matches are applied across hundreds of data points simultaneously at the hardware level.
3. Advanced HyperLogLog and Aggregation Algorithms
ClickHouse includes built-in probabilistic data structures that compute exact or approximate metrics with minimal memory overhead:
- `uniqExact(user_id)`: Calculates precise unique counts with optimized hash sets.
- `uniqCombined(user_id)`: Uses HyperLogLog algorithms to estimate distinct user counts across millions of rows with less than 1% error, completing in milliseconds.
```sql -- Calculating unique users across 500M rows in milliseconds SELECT toStartOfMonth(created_at) AS month, uniqCombined(user_id) AS estimated_mau FROM product_events WHERE workspace_id = 'c13b28ab-6e69-42b7-86f3-4d4b14d23d81' GROUP BY month ORDER BY month DESC; ```
4. Materialized Views for Instant Pre-Aggregation
When serving embedded, customer-facing SaaS dashboards, you cannot afford to query raw event tables on every page load. ClickHouse Materialized Views aggregate incoming data automatically during ingestion.
Unlike Postgres materialized views (which must be refreshed manually or via background jobs), ClickHouse Materialized Views act as insert triggers. When raw events are written to the main table, ClickHouse routes them through the view pipeline and updates aggregated state tables in real time.
Benchmark Performance Scenarios
To evaluate query performance under realistic conditions, we ran a series of analytical benchmarks comparing PostgreSQL 16 (tuned with 32GB RAM, 8 vCPUs) against ClickHouse 24.3 (same hardware instance) across a synthetic dataset of 100 million SaaS product events.
Benchmark 1: Simple Aggregation over Time Range
Query: Calculate total event counts grouped by day over a 90-day window for a specific workspace.
- Postgres (with B-Tree Index): 4.2 seconds
- ClickHouse (MergeTree Index): 0.018 seconds
- Speedup: ~233x faster in ClickHouse
Benchmark 2: High-Cardinality Unique Counting
Query: Count unique active users (`user_id`) grouped by event type across 100 million total rows.
- Postgres (`COUNT(DISTINCT)`): 38.6 seconds (high memory consumption)
- ClickHouse (`uniqExact`): 0.210 seconds
- ClickHouse (`uniqCombined` - HyperLogLog): 0.045 seconds
- Speedup: ~857x faster in ClickHouse
Benchmark 3: Multi-Property Funnel Step Analysis
Query: Filter events matching three distinct nested JSON key-value parameters (`properties->>'browser'`, `properties->>'plan'`, `properties->>'country'`) and aggregate by event name.
- Postgres (`jsonb` GIN Index): 11.4 seconds
- ClickHouse (Flattened Dynamic JSON Column): 0.082 seconds
- Speedup: ~139x faster in ClickHouse
Cost & Resource Efficiency Comparison
Database efficiency directly impacts your monthly cloud infrastructure costs. Here is how Postgres and ClickHouse compare when storing and querying a high-volume event stream.
Storage Footprint and Compression Ratio
Product analytics tables contain repetitive text strings like `event_name`, `browser`, `os`, and `country` alongside timestamps.
- Postgres: Stores data uncompressed on disk (except for large inline text using TOAST). A dataset of 100 million events with custom JSON metadata routinely consumes 45GB to 65GB of storage, plus an additional 15GB to 25GB for B-Tree indexes.
- ClickHouse: Applies specialized compression codecs column by column. The same 100 million event dataset consumes 6GB to 10GB total on disk. ClickHouse sparse indexes add less than 50MB of overhead.
Cost Implication: ClickHouse reduces raw disk storage requirements by up to 80% to 90%, significantly lowering AWS EBS or GCP Persistent Disk costs.
Compute and RAM Overhead
- Postgres: Requires high RAM allocations to maintain large B-Tree index pages in the Buffer Pool. As memory limits are hit, disk swap operations lead to unpredictable query latency spikes for concurrent users.
- ClickHouse: Uses RAM primarily during query execution for dynamic hash tables. Disk access reads continuous linear blocks, making standard Object Storage (like AWS S3 or Google Cloud Storage) via ClickHouse Cloud or Tiered Storage extremely fast and cost-effective.
Schema Evolution and Ingestion Patterns
Inserting individual event records one by one will degrade performance in columnar databases. Here is how ingestion and schema design differ between the two systems.
Ingestion Strategy

PostgreSQL (Row Inserts)
Postgres handles high-frequency single-row `INSERT` queries smoothly. Microservices can stream events straight into Postgres without buffering:
```python
Valid pattern in Postgres
for event in incoming_events: cursor.execute( "INSERT INTO product_events (workspace_id, user_id, event_name, properties) VALUES (%s, %s, %s, %s)", (event.workspace_id, event.user_id, event.name, json.dumps(event.props)) ) ```
ClickHouse (Batch Ingestion)
ClickHouse is optimized for large batch inserts. Inserting single rows creates thousands of small files on disk, triggering high CPU usage from constant background merges.
Event pipelines must buffer data in memory, write via Vector/Async queues, or stream through Apache Kafka before inserting in batches of 1,000 to 100,000 rows:
```python
Required pattern for ClickHouse: Batching
batch = [] for event in incoming_events: batch.append((event.workspace_id, event.user_id, event.name, json.dumps(event.props))) if len(batch) >= 5000: clickhouse_client.insert('product_events', batch) batch.clear() ```
Alternatively, you can enable ClickHouse's built-in `async_insert` setting, which buffers single inserts automatically on the server before writing to disk.
Handling Dynamic Custom Properties
SaaS platforms often allow end users to track custom properties attached to events. Both databases handle dynamic attributes differently:
- Postgres (`jsonb`): Flexible, but indexing deep or dynamic keys requires GIN indexes, which slow down insert speeds and balloon storage requirements.
- ClickHouse (Dynamic Sub-columns): ClickHouse automatically detects JSON paths during ingestion, flattening sub-keys into separate dynamic columns on disk. Querying `properties.plan.name` runs at native columnar speed without unmarshaling raw JSON strings at runtime.
Step-by-Step Architectural Migration Blueprint
If your SaaS platform currently runs analytics inside Postgres and query response times are degrading, follow this three-phase blueprint to migrate to ClickHouse with zero downtime.
Phase 1: Implement Async Dual-Writing
Do not attempt to read directly from Postgres using ETL jobs for real-time analytics. Instead, emit product events to an asynchronous message broker such as Kafka, RabbitMQ, or AWS Kinesis.
- Primary application writes continue streaming directly into PostgreSQL.
- The message broker broadcasts every event payload to a worker service.
- The worker service buffers events into batches of 5,000 or more records and performs bulk writes into ClickHouse.
Phase 2: Historical Data Backfill
Export historical data from Postgres without locking production application tables:
- Use Postgres `COPY` to export historical partitions into compressed Parquet or CSV files stored in an S3 bucket.
- Use ClickHouse's built-in `s3` table function to import historical files directly into ClickHouse parallelized across CPU cores:
```sql INSERT INTO product_events SELECT workspace_id, user_id, event_name, properties, created_at FROM s3('https://s3.amazonaws.com/your-bucket/exports/events_.parquet', 'Parquet'); ```
Phase 3: Query Layer Abstraction and Cutover
Create an internal Analytics API abstraction layer within your application backend:
- Update your analytics reporting service to query ClickHouse instead of Postgres.
- Keep Postgres as the primary fallback engine during initial testing.
- Validate query output parity between both systems using automated smoke tests.
- Deprecate and drop historical event tables from Postgres to reclaim disk space and reduce RAM usage.
Common Engineering Pitfalls to Avoid
Switching to a columnar database requires shifting away from relational design patterns. Avoid these four expensive design mistakes:
1. Treating ClickHouse Like a Relational Database
Do not design normalized schemas with foreign keys across dozens of tables in ClickHouse. Heavy multi-table `JOIN` operations consume significant RAM and run slowly in columnar databases. Denormalize your data during ingestion by embedding key user and workspace attributes directly into the event payload.
2. Issuing High-Frequency `UPDATE` or `DELETE` Queries
ClickHouse processes mutations asynchronously as full-part rewrites. Issuing continuous `UPDATE user_events SET...` queries will saturate disk I/O and degrade database performance. For mutable data, use the `ReplacingMergeTree` table engine or record updates as new state events appended to the end of the log.
3. Inserting Micro-Batches
Writing events 1 to 10 rows at a time will cause ClickHouse to create millions of tiny data parts on disk. This results in the error: `"Too many parts in all data parts in table"`. Always buffer events to write in batches of at least 1,000 rows, or turn on `async_insert = 1` in server configuration.
4. Selecting Everything (`SELECT *`)
In a row database like Postgres, `SELECT ` adds minimal overhead if the entire row is already loaded into memory. In ClickHouse, running `SELECT ` forces the engine to open and decompress every single column file on disk, destroying query performance. Select only the specific columns required for your analysis.
Real-World SaaS Use Cases and Decision Framework
Follow this structured framework to select the right database setup based on your current event scale and technical requirements:
| Monthly Event Volume | Recommended Engine | Primary Architectural Focus | Key Advantage |
|---|---|---|---|
| Under 10M events | PostgreSQL (Relational) | Single production DB, monthly table partitioning | Zero pipeline complexity, fast relational joins |
| 10M to 50M events | PostgreSQL + TimescaleDB | Hypertable compression, continuous aggregates | Keeps existing Postgres schema while cutting storage costs |
| Over 50M events | ClickHouse (Cloud or Managed) | Columnar storage, async message broker batching | Sub-second queries over billions of rows, 90% compression |
Case A: Early-Stage B2B SaaS (Less than 10M events/month)
- Choice: Stick with PostgreSQL.
- Why: Focus on product-market fit rather than managing complex infrastructure. Use basic B-Tree/BRIN indexes and partition tables by month. Keep analytics code close to main application code.
Case B: Mid-Stage SaaS with Growing Analytics (10M - 50M events/month)
- Choice: Install TimescaleDB on existing Postgres instance, or introduce a managed ClickHouse instance.
- Why: If your main product database is showing signs of memory bloat or slow dashboard loads, introducing TimescaleDB adds columnar compression to historical Postgres data with zero schema changes. If you plan to build rich customer-facing embedded analytics, start streaming events to ClickHouse now.
Case C: Scale-Up SaaS / Customer-Facing Analytics (Over 50M events/month)
- Choice: ClickHouse (Managed or Self-Hosted via Kubernetes/Altinity).
- Why: Essential for sub-second, multi-tenant customer-facing analytics dashboards. Columnar data structures let you run complex funnel queries, cohort retentions, and high-cardinality aggregations over billions of events at low cloud infrastructure costs.
Conclusion and Next Steps
Both PostgreSQL and ClickHouse excel at what they were designed to do. Postgres remains the gold standard for transactional SaaS data, user management, and application workflows. ClickHouse is the undisputed leader for high-throughput, low-latency product analytics at scale.
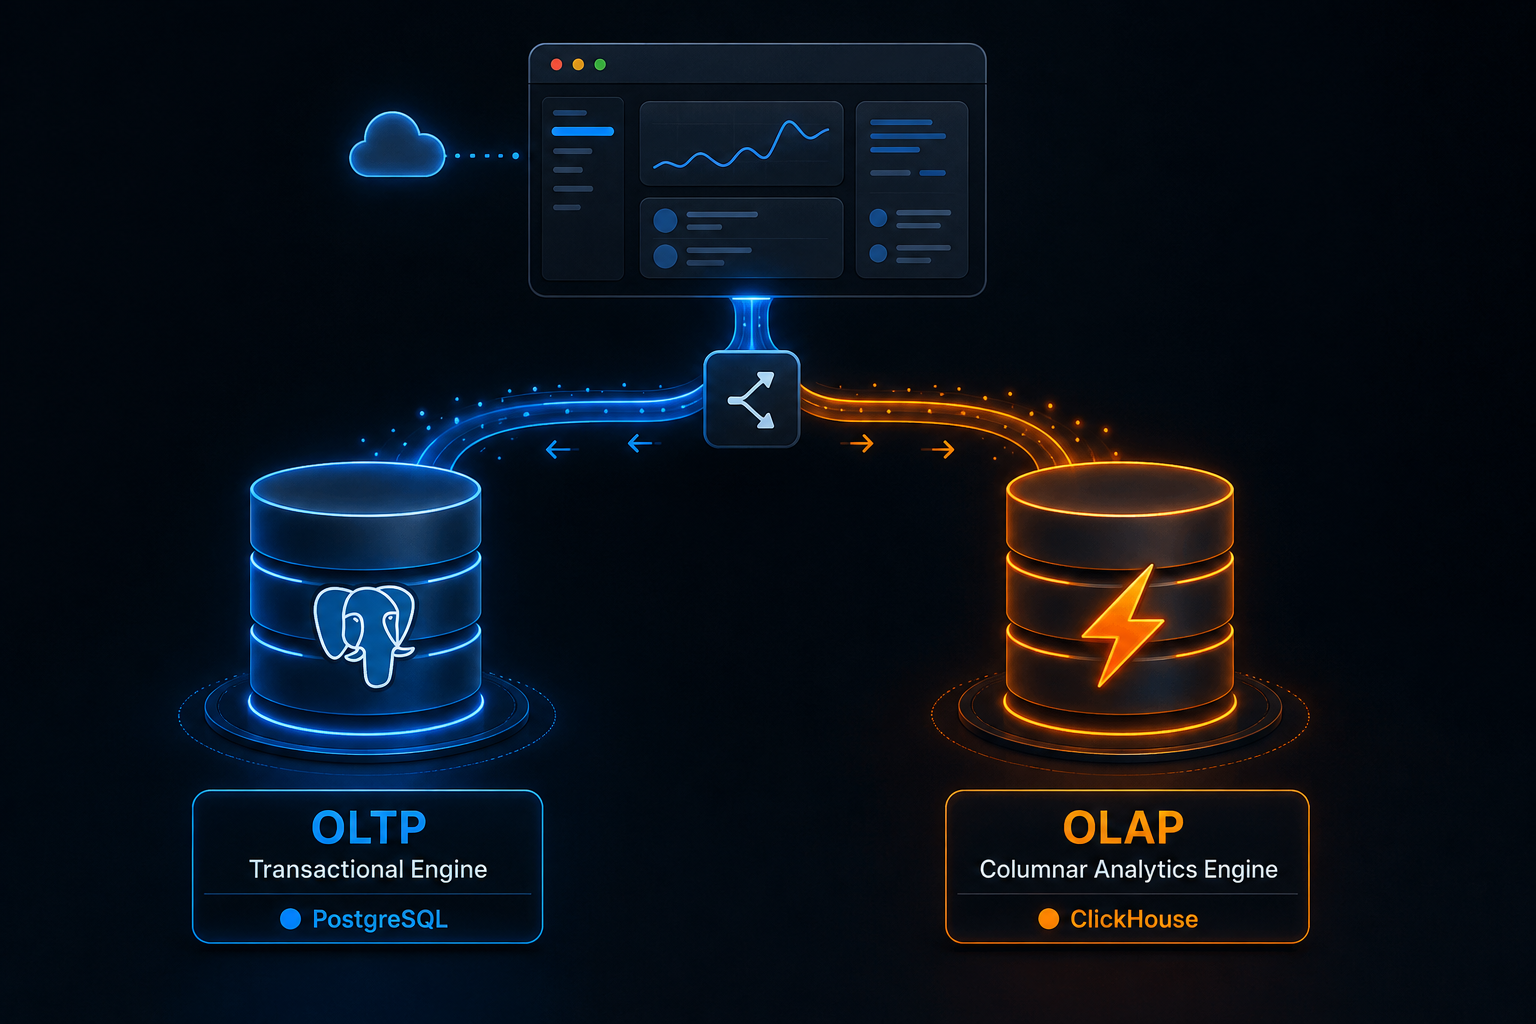
Instead of viewing them as competitors, structure your architecture to leverage both: Postgres as your primary transactional engine, and ClickHouse as your dedicated real-time analytical engine.
If you are evaluating software tools, data pipelines, or database platforms to power your growth, check out Saasbonus for hands-on, independent reviews, architectural teardowns, and software insights to help you build the right tech stack the first time.