SaaS Customer Health Score: Build a Better Framework
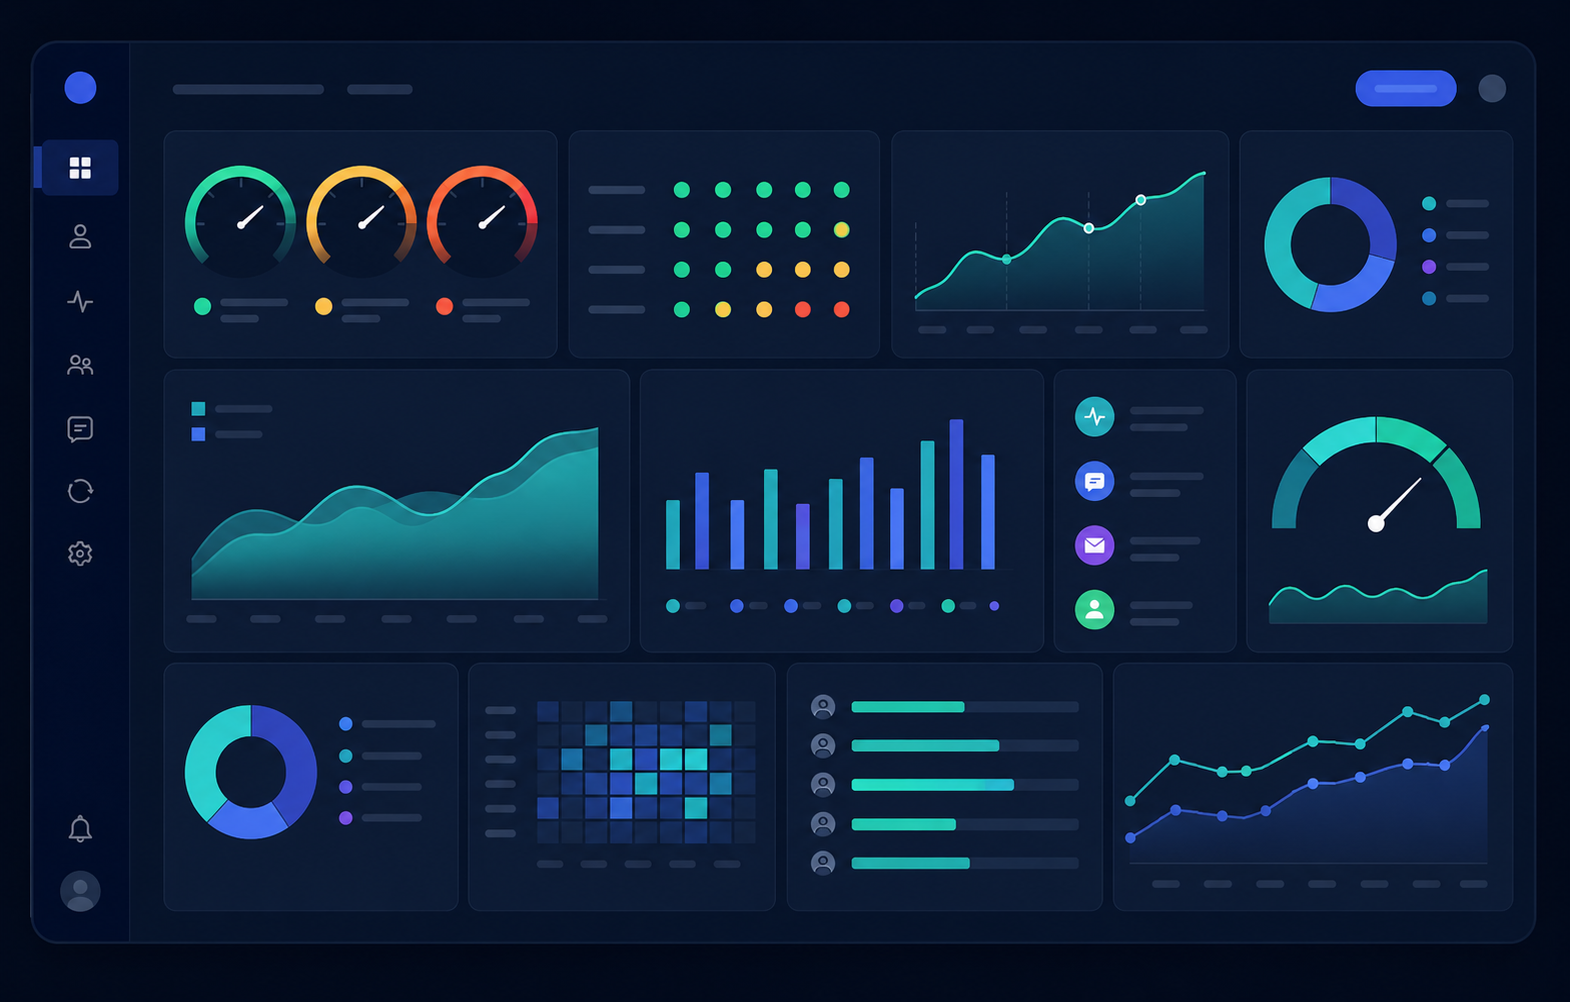
A SaaS customer health score is useful only when it helps your team decide what to do next. A dashboard showing an account as green does not prevent churn. Neither does a high login count prove that a customer is receiving enough value to renew.
The practical approach is to combine a small set of meaningful product, support, relationship, and commercial signals into a score that changes as customer behavior changes. Then connect that score to clear actions for Customer Success, RevOps, and account leadership.
There is no universal customer health formula that works for every SaaS company. The right model depends on how customers use your product, how quickly they reach value, who makes renewal decisions, and which behaviors have historically appeared before retention, contraction, or churn.
This guide explains how to build a SaaS customer health score from the ground up, how to calculate it, how to weight metrics by lifecycle stage, and how to turn score changes into repeatable CS playbooks.
What Is a SaaS Customer Health Score?
A SaaS customer health score is a numerical or tiered assessment of an account's current relationship with your product. Most teams use a 0 to 100 scale or classify accounts as Red, Yellow, or Green.
The score normally combines several signals, such as:
- Product adoption and feature usage
- Active seat or license utilization
- Support volume and issue severity
- Customer satisfaction and effort
- Executive or champion engagement
- Payment behavior
- Contract and renewal information
- Changes in usage over time
The important part is not the number itself. It is whether the score reflects customer behavior accurately enough to guide action.
For example, an account with 90 percent seat utilization may look healthy. But if its most important workflow has stopped running, its executive sponsor has left, and a critical support issue has been open for three weeks, a simple usage-based score is misleading.
A strong B2B SaaS customer health score captures both positive signals and emerging risks. It also gives Customer Success managers enough context to understand why an account changed from healthy to at risk.
What Makes a Customer Health Score Useful?
A useful health score has four characteristics.
It Measures Leading Indicators
A health score should help your team see risk before the commercial outcome is final. Declining usage, falling feature adoption, lower engagement, and unresolved product problems can provide earlier warnings than a cancellation notice.
Not every leading indicator is predictive for every business. Your team should validate which behaviors actually precede churn rather than assuming that a familiar metric is automatically useful.
It Changes With Customer Behavior
A score that barely moves for months is not very helpful. Customer health should respond to meaningful changes in usage, support experience, engagement, and commercial conditions.
At the same time, avoid making the score so sensitive that one unusual day changes an account from Green to Red. Rolling averages, trend measures, and minimum observation periods can make the model more stable.
It Fits the Customer Lifecycle
A new customer has different risks from a customer approaching renewal. During onboarding, implementation progress and time to first value may matter most. Later, adoption depth, business outcomes, executive alignment, and commercial signals may carry more weight.
It Triggers an Action
A score should answer two questions: What changed, and what should the team do about it?
If a Red score simply appears in a dashboard, your organization has created reporting rather than an operating system for retention.
Why Customer Health Scores Often Fail
Many health scoring projects start with good intentions but become unreliable because the model is built around convenient data instead of meaningful customer outcomes.
1. Login Counts Become a Vanity Metric
Login frequency is easy to measure, so it often receives too much attention. But logging in is not the same as receiving value.
A customer might log in frequently because the product is central to daily work. Another customer might use an automated workflow that delivers significant value without requiring frequent manual logins.
Instead of asking only how often users log in, ask what they accomplish when they use the product. Track the actions that represent meaningful adoption.
2. Every Metric Gets the Same Weight
A simple average is attractive because it is easy to explain. It can also hide serious risks.
Suppose an account has strong product usage but an unresolved business-critical support problem and no active executive sponsor. Giving each category the same weight may produce a comfortable overall score even though the account has two major renewal risks.
Weights should reflect the actual importance of each signal. Critical conditions may also need override rules rather than relying on the average at all.
3. One Model Is Used for Every Lifecycle Stage
A customer that has been live for two weeks cannot be judged by the same adoption benchmark as a customer that has used the product for three years.
During onboarding, implementation milestones, integration completion, training participation, and time to first value can be more informative. During mature adoption, feature depth, breadth of usage, business outcomes, and executive alignment may matter more.
4. The Score Is Too Complicated to Explain
Adding dozens of metrics does not necessarily improve predictive power. It can make the score harder to trust and nearly impossible for a CSM to explain to a customer-facing team.
Start with a small set of signals. Add new inputs only when you can explain what they measure, why they matter, and how the additional complexity improves decisions.
5. CSM Judgment Is Either Ignored or Uncontrolled
Quantitative data cannot capture every important customer development. A CSM may learn that a customer is restructuring, changing vendors, or preparing for a major internal project before that information appears in product data.
The answer is not to let anyone freely change a health score. Instead, provide structured override fields, reason codes, notes, and an audit trail so qualitative judgment can complement the model without destroying consistency.
The Four Pillars of a SaaS Customer Health Score
A balanced health score usually draws from four broad categories: product usage, service and support, relationship engagement, and financial or commercial health.
1. Product Usage and Adoption
Product usage is often the largest source of behavioral data. The key is to measure meaningful usage rather than activity for its own sake.
Breadth of Adoption
Breadth measures how widely the product is used across the purchased user base.
A basic utilization calculation is:
Active seats divided by purchased seats, multiplied by 100
For example, if 70 of 100 purchased seats are regularly active, the utilization rate is 70 percent.
That number becomes more useful when compared with your own historical retention data. A 70 percent utilization rate might be healthy for one product and weak for another.
Depth of Adoption

Depth measures how extensively customers use the capabilities that create value.
For a project management platform, creating tasks might be basic usage. Building automated workflows, managing dependencies, using reporting features, and coordinating multiple teams may represent deeper adoption.
The exact definition should come from your product's value proposition.
Frequency and Usage Trends
Frequency shows how regularly customers perform important actions. Trend data is often more useful than a single snapshot.
A customer whose activity falls steadily over six weeks may deserve attention even if its current usage level still appears acceptable. Look at rolling trends rather than reacting to isolated fluctuations.
2. Service and Support Signals
Support data can reveal friction that product analytics cannot see.
Useful signals include:
- Number of open support cases
- Changes in ticket volume
- Severity of unresolved issues
- Time to resolution
- Repeated tickets about the same problem
- Customer satisfaction after support interactions
- Escalations involving senior stakeholders
A sudden increase in tickets can indicate a product problem, implementation issue, or training gap. A sudden decline can also be meaningful if a previously engaged account has stopped contacting your team because users have stopped using the product.
Avoid assuming that fewer tickets always means better health.
3. Relationship and Executive Engagement
In many B2B SaaS businesses, renewal decisions involve people who do not use the product every day. That makes relationship health important.
Track whether the customer has an active champion, whether executive stakeholders participate in business reviews, and whether the customer can clearly describe the business value they receive.
A champion leaving the company should not automatically mean churn is certain. It should, however, trigger a review of stakeholder coverage and account strategy.
Useful relationship signals include:
- Active champion status
- Executive sponsor status
- Stakeholder coverage
- Business review participation
- Response rates to important communications
- Customer-reported goals and outcomes
- Evidence that the product is still aligned with business priorities
4. Financial and Commercial Health
Commercial data provides another important view of account risk.
Useful inputs can include:
- Invoice payment history
- Failed payments
- Days past due
- Contract value changes
- Seat reductions
- Renewal timing
- Discount requests
- Procurement or legal delays
These signals require context. A late invoice may result from an administrative error rather than budget pressure. A request to reduce seats may be part of normal workforce changes rather than dissatisfaction.
Use financial signals as part of the overall account picture instead of treating every commercial event as proof of churn intent.
How to Build a SaaS Customer Health Score Framework
A practical framework can be built in five stages. The goal is to create a model that is simple enough to operate and sophisticated enough to improve with evidence.
Step 1: Define the Customer Value Moment
Start with the question: What action shows that a customer is receiving meaningful value from the product?
This could be a completed workflow, successful integration, recurring campaign, activated team, automated process, or measurable business outcome.
For example, an email marketing platform may care about campaign creation, audience activation, recurring sends, and engagement with campaign reporting. A developer platform may care more about successful API activity, production deployment, and recurring application usage.
Do not copy another company's value moment. Define yours from product behavior and customer outcomes.
Step 2: Choose Five to Seven Strong Indicators
Start small. A useful initial model might include:
- Active seat utilization
- Core feature adoption
- Change in usage over a rolling period
- High-severity support issues
- Customer satisfaction or effort
- Champion or executive engagement
- Payment status
You may need fewer metrics. The right number depends on your product and available data.
The test is simple: Can a CSM explain what each metric means and what action should follow when it deteriorates?
Step 3: Normalize the Metrics
Your inputs will have different units. Seat utilization is a percentage, support severity may be categorical, payment status may be measured in days, and feature usage may be an event count.
Convert them to a common scale before combining them.
A simple 0 to 100 approach could look like this:
| Metric | Healthy Example | Risk Example |
|---|---|---|
| Seat utilization | 75 percent or higher | Below 35 percent |
| Core feature usage | Consistent adoption | Sustained decline |
| Support issues | Low severity and timely resolution | Critical issue remains open |
| Executive engagement | Active sponsor and regular engagement | Sponsor unavailable or departed |
| Payment status | Current | Materially overdue |
These thresholds are examples, not universal benchmarks. Your historical customer data should determine the final boundaries.
Step 4: Assign Customer Health Score Weighting
After normalization, assign weights according to the importance of each signal.
For an adoption-stage customer, one illustrative model could be:
| Metric | Weight |
|---|---|
| Seat utilization | 30% |
| Core feature adoption | 25% |
| Usage trend | 15% |
| Support health | 10% |
| Executive engagement | 10% |
| Payment status | 10% |
The weights add up to 100 percent.
The important point is not the exact distribution. It is the reasoning behind it. If historical churn analysis shows that product adoption is much more predictive than survey sentiment, the model should reflect that finding.
Step 5: Add Override Rules
Some conditions should not be diluted by an average score.
For example, you may decide that a business-critical unresolved incident requires a manual risk review regardless of the account's composite score. You may also want a separate review when an account becomes materially overdue or loses a critical sponsor.
Define these rules in advance and document who can override them.
Lifecycle-Based Customer Health Scoring
Customer health changes meaning throughout the customer lifecycle. A lifecycle-aware model can reduce false alarms and make CSM actions more relevant.
| Lifecycle Stage | Main Focus | Example Metrics | Illustrative Weighting |
|---|---|---|---|
| Onboarding | Implementation and first value | Integration completion, activation, training, time to first value | Setup 45%, usage 30%, support 25% |
| Adoption | Consistent product value | Seat utilization, core features, usage trend, support | Usage 50%, support 20%, engagement 20%, financial 10% |
| Renewal | Value, relationship, and commercial readiness | Business outcomes, sponsor engagement, payment status, adoption | Engagement 30%, usage 30%, financial 25%, support 15% |
| Expansion | Growth potential and sustained value | Adoption depth, unused capacity, stakeholder coverage, outcomes | Usage 35%, engagement 30%, outcomes 25%, commercial 10% |
These weights should be treated as a starting point. Backtest them against your own customer outcomes before putting them into production.
Onboarding Health
During onboarding, customers need to reach value quickly. Useful signals include implementation milestones, integration completion, user activation, training progress, and time to first successful outcome.
A customer that has not activated key workflows after several weeks may be at risk even if the contract is large and the implementation team is responsive.
Adoption Health
Once the customer is live, the emphasis can shift toward sustained usage and feature depth.
Look for consistent use of the workflows that matter most. A large number of active users is helpful, but broad adoption is not enough if those users rarely use the features that create business value.
Renewal Health
As renewal approaches, business outcomes and commercial readiness become increasingly important.
Ask whether the customer can explain the value they received, whether the right decision-makers are engaged, whether the product is still aligned with priorities, and whether there are unresolved procurement or billing issues.
How to Calculate a Customer Health Score
The most straightforward mathematical approach is a weighted average.
The formula is:
Health Score = sum of each normalized metric score multiplied by its assigned weight
Each metric should first be converted to a 0 to 100 scale, and all weights should add up to 1.0 or 100 percent.
Customer Health Score Example
Suppose an adoption-stage customer has the following results:
| Metric | Score | Weight | Weighted Result |
|---|---|---|---|
| Seat utilization | 80 | 35% | 28.0 |
| Core feature usage | 90 | 25% | 22.5 |
| Support satisfaction | 80 | 15% | 12.0 |
| Executive engagement | 100 | 15% | 15.0 |
| Payment status | 100 | 10% | 10.0 |
| Total | 100% | 87.5 |
The resulting health score is 87.5 out of 100.
If your organization defines 75 and above as Green, this account would be Green. But the number should still be reviewed alongside the underlying metrics. A composite score is a summary, not a replacement for account context.
Choosing Health Score Tiers
A three-tier model is easy for teams to understand.

| Status | Example Score | Typical Meaning | Suggested Response |
|---|---|---|---|
| Green | 75 to 100 | Healthy and stable | Protect value and identify growth opportunities |
| Yellow | 50 to 74 | Emerging risk or mixed signals | Investigate causes and run a targeted intervention |
| Red | Below 50 | Significant risk | Create an account recovery plan and assign ownership |
These boundaries are starting points rather than industry standards. If 90 percent of your customers naturally cluster between 80 and 95, the model may need different thresholds or stronger trend signals.
A good tiering system should separate customers with materially different outcomes, not simply produce an attractive distribution of colors.
When a Weighted Average Is Not Enough
Some companies benefit from a matrix or rule-based model instead of relying entirely on a composite score.
A matrix approach can classify accounts based on critical prerequisites. For example, an account might remain Green only when core adoption is healthy, there are no critical unresolved issues, and commercial risk is within acceptable limits.
This approach is useful when certain conditions are effectively non-negotiable.
For example, an account with excellent feature adoption and a materially overdue strategic contract may need immediate commercial attention. A simple average can hide that relationship.
A hybrid model often works well: use a weighted score for overall health and separate override rules for conditions that require immediate review.
Turn Health Scores Into CS Playbooks
The health score should lead to an operational response. Otherwise, the team is measuring risk without managing it.
Red Health Playbook
A Red account might have a low composite score, a critical product problem, a major adoption decline, or another predefined risk trigger.
The response should start with diagnosis rather than a generic outreach email.
- Create a risk task in the CRM or customer success platform.
- Assign a clear owner and deadline.
- Review product usage, support history, stakeholder activity, and commercial status.
- Identify the primary cause of the health decline.
- Contact the customer with a specific plan rather than a generic check-in.
- Escalate to leadership when the issue requires executive intervention.
- Record the recovery plan and expected next milestone.
The goal is not to make the score green as quickly as possible. The goal is to resolve the underlying problem.
Yellow Health Playbook
Yellow accounts need investigation before they become Red.
A practical response could include:
- Review which individual metrics caused the decline.
- Compare current behavior with the customer's previous baseline.
- Identify inactive teams, features, or workflows.
- Review recent support interactions.
- Ask the customer whether priorities or internal ownership have changed.
- Provide targeted training, documentation, or implementation help.
- Set a follow-up date and measure whether the signal improves.
Avoid treating every Yellow account as a sales opportunity. Some need education, product support, or better stakeholder alignment first.
Green Health Playbook
Green accounts still require attention. Healthy customers can become at risk when their needs change or competitors enter the picture.
For stable accounts, the team can focus on reinforcing value, identifying additional use cases, expanding stakeholder coverage, and exploring growth opportunities when there is clear evidence of customer demand.
Expansion should be a consequence of customer value, not simply a reward for having a high score.
Health Score Software and Data Architecture
Health scoring becomes harder as data volume and customer complexity increase. Your architecture should match your company's maturity rather than forcing an expensive platform into an immature process.
Early Stage: SQL and Lightweight Tools
An early SaaS company may be able to combine product data, CRM fields, and billing information in a warehouse or database and calculate scores with SQL.
A spreadsheet can work for testing a framework with a small customer base. It becomes less attractive as the number of accounts, data sources, and score updates increases.
The main advantage is control. Your team can test the model without committing to a dedicated customer success platform.
Growth Stage: Product Analytics and CRM Automation
Growing companies can connect product analytics, CRM, support, and billing systems through their existing data stack.
Platforms such as Mixpanel, Amplitude, and PostHog can provide product behavior data, while systems such as HubSpot or Salesforce can hold account context and trigger workflows.
The biggest requirement is data quality. If an event name changes or an integration stops syncing, the health score can quietly become unreliable.
Scale Stage: Dedicated Customer Success Platforms
Larger organizations may benefit from customer success platforms such as Gainsight, ChurnZero, Totango, Vitally, or Planhat.
These systems can centralize account health, lifecycle scoring, customer success tasks, and playbooks. The value comes from operational scale rather than the label of the software itself.
Before purchasing a dedicated platform, define the scoring logic you actually need. Software won't fix unclear metrics or poor underlying data.
For independent software comparisons and technology research, Saasbonus can also help teams compare tools, features, integrations, and pricing considerations before committing to a customer success stack.
How to Audit and Backtest Your Health Score
A health score should be treated as a model that needs validation. If it consistently labels customers as healthy until shortly before they churn, it is not providing enough early warning.
Step 1: Build Historical Cohorts
Review customers that renewed, expanded, contracted, or churned during a defined historical period.
For each account, examine the health score and individual metrics at consistent points before the outcome, such as 90, 60, and 30 days before renewal.
This shows whether the model actually moved before the commercial outcome.
Step 2: Compare Predictions With Outcomes
Track false positives and false negatives.
A false positive occurs when the model identifies an account as high risk but the customer ultimately renews or expands without significant intervention.
A false negative occurs when the model classifies an account as healthy but the customer later contracts or churns.
Neither type of error is automatically unacceptable. The appropriate balance depends on the cost of missing churn risk versus the cost of spending CSM time on accounts that recover naturally.
Step 3: Review Individual Signals
Don't only adjust the final score. Examine which metrics actually moved before customer outcomes.
If usage trends consistently deteriorate before churn while survey scores remain stable, usage may deserve more weight. If executive engagement changes frequently before renewal risk appears, stakeholder coverage may need greater attention.
The model should evolve from evidence, not intuition alone.
Common Customer Health Score Mistakes
Mistake 1: Copying Another Company's Formula
A health score designed for a low-touch self-service product may be a poor fit for enterprise software with complex implementation and multiple decision-makers.
Use other frameworks as inspiration, not as a substitute for your own customer data.
Mistake 2: Treating the Score as a Churn Probability
A score of 40 does not automatically mean that the customer has a 40 percent probability of churn.
Unless the model has been statistically calibrated against historical outcomes, the number is an index, not a probability.
This distinction matters when presenting health scores to executives.
Mistake 3: Ignoring Trends
A customer can have a high current score while moving rapidly in the wrong direction.
Include trend information where it is useful. A declining score over several weeks may deserve more attention than a slightly lower score that has remained stable for months.
Mistake 4: Adding Too Many Metrics
More inputs can make a model look sophisticated while making it harder to maintain. Start with the signals that your team can explain and act on.
Mistake 5: Allowing Uncontrolled Manual Changes
CSMs should be able to add context, but manual overrides need structure. Require a reason, supporting notes, and an expiration or review date where appropriate.
Mistake 6: Ignoring Product Incidents
A major outage or recurring product defect can affect many customers simultaneously. Your health model should have a way to account for material incidents rather than assuming every account behaves independently.
A Practical Customer Health Score Template
Teams starting from scratch can use the following structure as a working template:
| Category | Metric | Example Weight | Update Frequency | Action When Risk Increases |
|---|---|---|---|---|
| Product | Active seat utilization | 20% | Daily | Review adoption by team |
| Product | Core feature adoption | 20% | Daily | Identify missing workflows |
| Product | Usage trend | 15% | Weekly | Investigate sustained decline |
| Support | Critical open issues | 10% | Near real time | Escalate unresolved blockers |
| Relationship | Champion or sponsor engagement | 15% | Weekly | Map stakeholders and reconnect |
| Customer feedback | CSAT or structured sentiment | 10% | Weekly or monthly | Review recurring friction |
| Commercial | Payment and renewal status | 10% | Daily | Resolve billing or renewal risk |
Adjust the categories and weights to match your business. The template is a starting structure, not a benchmark.
How to Improve the Model Over Time
A first version of a health score should be treated as a working model rather than a permanent formula.
Start with reliable data and a small number of meaningful metrics. Then compare the model's predictions with actual customer outcomes.
Over time, you can improve the framework by:
- Adding account-level rather than user-level aggregation where appropriate.
- Separating onboarding, adoption, renewal, and expansion scoring.
- Introducing trend and velocity measures.
- Adding structured qualitative inputs from CSMs.
- Creating explicit override rules for critical events.
- Backtesting the score against historical customer outcomes.
- Removing metrics that provide little predictive or operational value.
- Updating thresholds as your product, customers, and usage patterns change.
If your data set is large enough, you can eventually test statistical or machine learning approaches. But predictive churn modeling should come after basic data quality and operational discipline. A sophisticated model built on inconsistent event tracking will not produce trustworthy results.
Key Takeaways
A SaaS customer health score should help your team understand account trajectory and decide where to focus attention.
The strongest frameworks share a few principles:
- Measure meaningful customer behavior, not activity for its own sake.
- Combine product, support, relationship, and commercial signals.
- Normalize metrics before combining them.
- Use customer health score weighting based on evidence and business context.
- Adjust the model for lifecycle stage.
- Use trend data when it provides a clearer signal than a snapshot.
- Create override rules for genuinely critical conditions.
- Connect Red, Yellow, and Green states to specific CS playbooks.
- Backtest the model against real retention and churn outcomes.
- Remove metrics that add complexity without improving decisions.
The best health score isn't the one with the most data. It's the one your team trusts enough to act on, your customers' behavior supports, and your historical outcomes can validate.
A well-designed framework can become an important part of a broader retention strategy and help Customer Success teams focus their time where intervention has the greatest potential value. Review your current account data, identify the product behaviors that signal real value, and build the simplest scoring model that can reliably turn those signals into action.