Sentry vs Datadog: Best SaaS Monitoring Tool?
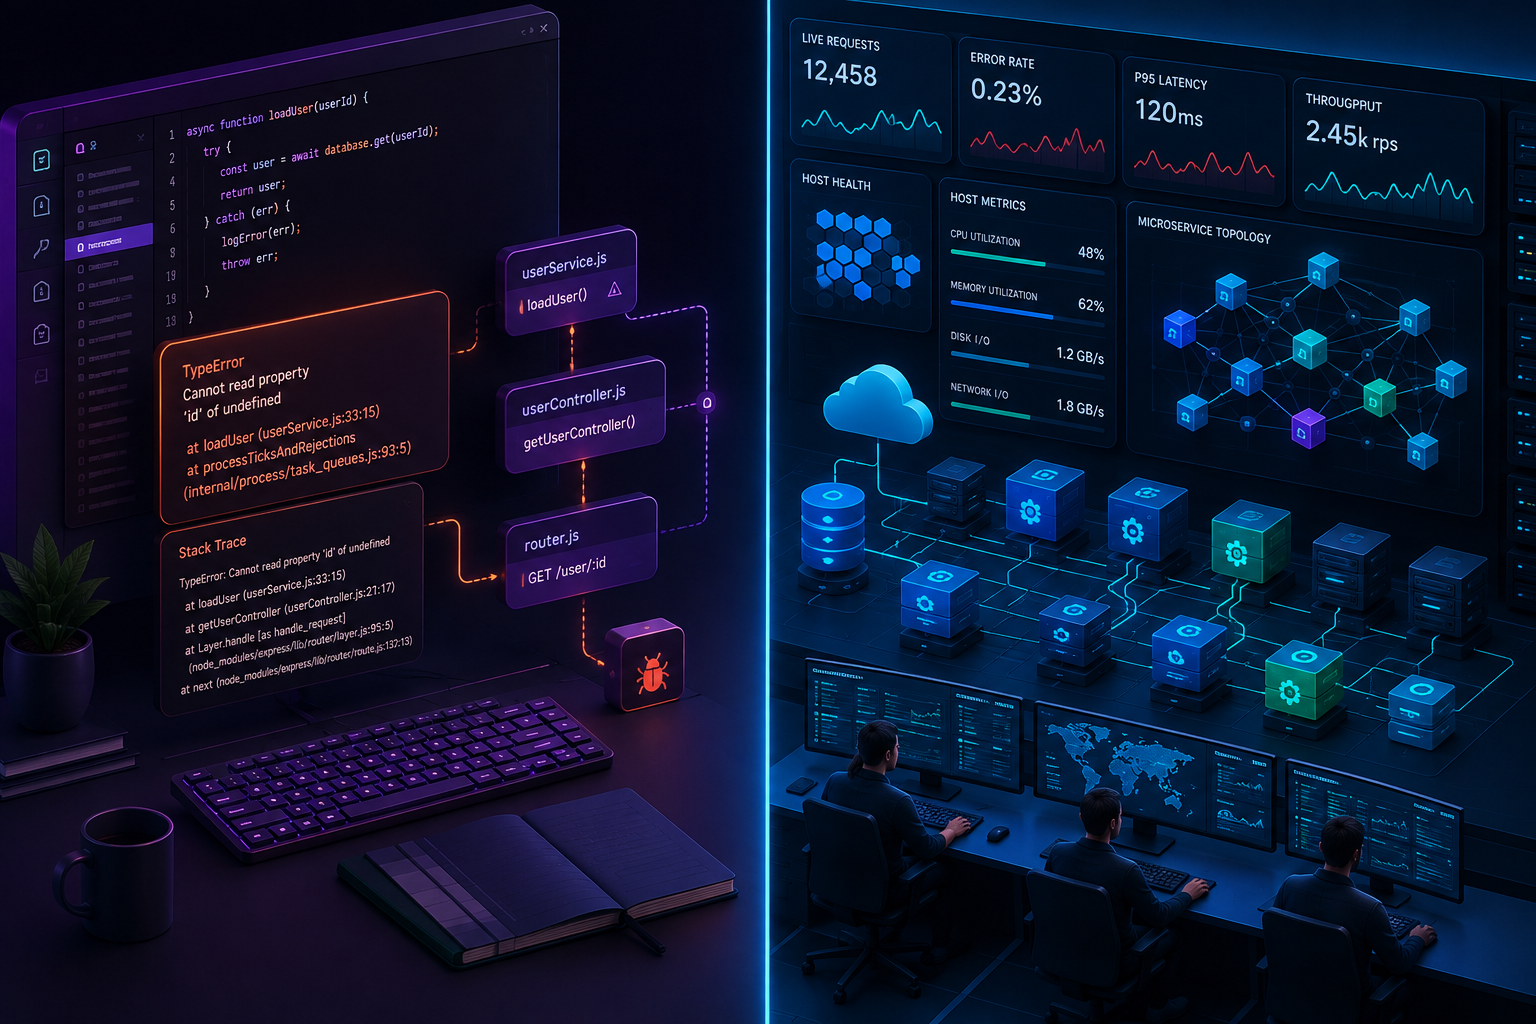
Sentry and Datadog both monitor production applications, but they solve different problems: Sentry is an application-level debugging platform built for developers who need to fix broken code, while Datadog is an infrastructure-wide observability suite designed for system administrators, site reliability engineers, and enterprise operations teams.
Choosing the wrong monitoring tool can create significant operational issues. Picking a platform that is too broad leaves developers drowning in infrastructure metrics when all they need is a stack trace and a git commit hash. Conversely, choosing a tool that is too narrow leaves site reliability engineers blind to network latency spikes, database thread starvation, and cloud provider outages.
The fundamental difference comes down to focus: Sentry goes deep into application code, stack traces, release health, and user session replays. Datadog goes wide across cloud infrastructure, container orchestrators, log management pipelines, network flows, and runtime security.
Here is a direct comparison of how Sentry and Datadog stack up for SaaS applications across core engineering vectors.
| Feature Vector | Sentry | Datadog |
|---|---|---|
| Primary Focus | Code debugging, exception tracking, release health | Full-stack observability, infrastructure, APM, security |
| Target Persona | Software engineers, frontend developers, product teams | Site reliability engineers, DevOps, IT operations leaders |
| Pricing Structure | Event volume-based, flat base plan, unlimited team seats | Per-host, per-service, per-indexed log, custom metric add-ons |
| Infrastructure Monitoring | Basic uptime and cron execution checks | Enterprise host, container, serverless, and network monitoring |
| Error Grouping | Automated fingerprinting and deduplication | Basic exception listing integrated into APM trace samples |
| Session Replay | Native video-like user interaction replays linked to errors | Real User Monitoring (RUM) with browser session tracking |
| AI Capabilities | Seer AI agent for root cause analysis and auto-generated PRs | Bits AI SRE agent for system-wide incident triage |
| Entry Cost | Free tier available; Team tier starts at 26 USD per month | Infrastructure starts at 15 USD per host per month (annual) |
The Core Architectural Difference: Code-First vs. Infrastructure-First
Understanding why these platforms feel so different requires examining how each tool was originally architected.
Sentry was created as an open-source error logging system designed to catch unhandled runtime exceptions. When an application crashes, Sentry captures the exact state of the call stack, global variables, local variables, HTTP request headers, and user actions that led up to the event. Its entire interface is built to answer three specific developer questions: What broke, who introduced the breaking code change, and how do we reproduce it?
Over the years, Sentry added application performance monitoring (APM), continuous profiling, trace linking, and log aggregation. However, every feature in Sentry remains anchored to the code line. Its tracing features exist to show developers which function call slowed down an endpoint. Its log aggregation system connects directly to span IDs and trace IDs so developers can jump straight from an exception to surrounding log output.
Datadog was engineered from day one as a metrics and infrastructure collection engine. It uses a lightweight host agent written in Go that runs alongside your application services, container daemons, and cloud infrastructure. Datadog ingests time-series metrics from cloud environments, Linux kernels, PostgreSQL databases, Kubernetes pods, and NGINX proxies.
Datadog added APM, error collection, log management, and synthetics atop this time-series infrastructure foundation. When an incident occurs in Datadog, the starting point is usually a system dashboard showing CPU utilization, memory pressure, or network packet drops across host clusters. From that high-level metric, engineers drill down into microservice traces and individual container log streams.
This core architectural difference impacts how both tools handle SaaS application monitoring day to day.
Deep Feature Comparison for SaaS Engineering Teams
Evaluating Sentry against Datadog for a production SaaS platform requires examining four critical operational areas: error tracking, APM and distributed tracing, log management, and frontend user monitoring.
1. Error Tracking and Exception Deduplication
When a SaaS application handles millions of API requests daily, unhandled exceptions will happen. The primary challenge is not catching errors, but filtering out noise so engineering teams can focus on actionable bugs.
Sentry remains the benchmark for exception handling. It uses intelligent fingerprinting algorithms that analyze the structural layout of stack traces rather than matching raw text strings. If an error occurs in ten different worker threads with varying memory addresses or timestamps, Sentry collapses all ten instances into a single issue thread.
Key advantages of Sentry for error tracking include:
- Automatic integration with Git repositories to assign suspect commits to the exact developer who authored the line of code.
- Native release tracking that shows whether a bug was introduced in a specific release tag or commit sha.
- Granular breadcrumbs that show every console log, network fetch request, DOM click, and database call leading up to the crash.
- Automated issue workflow controls that reopen a resolved issue if the bug reappears in a subsequent deployment.
Datadog tracks errors through its APM module, treating exceptions as attributes attached to distributed spans. When a request fails, Datadog flags the span as an error and logs the exception message. While Datadog provides error lists and basic grouping, its deduplication algorithms are less specialized than Sentry's.
In Datadog, a sudden spike in unhandled exceptions often manifests as thousands of individual error spans across multiple trace graphs. Grouping those spans into a single issue thread requires manual querying or pre-configured parsing rules. For engineering teams focused on resolving code bugs quickly, Sentry provides clearer signal-to-noise ratio out of the box.
2. APM, Distributed Tracing, and Service Mapping
Modern SaaS platforms rarely run as single monolithic processes. They rely on distributed architectures with frontend frameworks, API gateways, microservices, background job queues, and managed databases. Distributed tracing maps request journeys through these complex systems.
Datadog offers one of the most comprehensive APM platforms available. Because its agent operates at the infrastructure level, Datadog automatically discovers microservices, builds dynamic service maps, and correlates network performance with application traces.

Datadog APM highlights include:
- Continuous Profiler: Measures CPU and memory utilization at the code-method level in production with minimal overhead.
- Dynamic Instrumentation: Allows engineers to insert log statements and capture variables from running production code without redeploying services.
- Automated Service Maps: Visualizes service dependencies, latency bottlenecks, and error propagation across microservices.
- High-Cardinality Analytics: Filters traces by custom tags such as tenant ID, user subscription tier, region, or API route.
Sentry includes APM capabilities, but its tracing scope is restricted to the application layer. Sentry uses transaction monitoring and span trees to visualize performance. You can see how long a database query took, how long an HTTP fetch request took, and which internal function caused a response delay.
However, Sentry does not map infrastructure-level bottlenecks. If an endpoint slows down because an Amazon EC2 host is experiencing disk I/O throttling or a Kubernetes pod is hitting cgroup memory limits, Sentry shows the delayed span, but cannot explain the underlying infrastructure cause. Datadog bridges that gap directly by correlating trace latency with host metric spikes.
3. Log Management and Aggregation
Log management is another area where the platforms' operational scopes diverge dramatically.
Datadog Log Management is an enterprise-scale log analytics platform. It ingests raw logs from operating systems, Docker containers, cloud services, firewalls, and application runtimes. Datadog decouples log ingestion from log indexing, allowing teams to archive massive log volumes to cheap cloud storage while indexing only the high-value logs needed for real-time alerting and search.
Datadog allows teams to build complex log pipelines, parse unstructured log lines using custom grok patterns, build time-series dashboards from log metrics, and establish anomaly alerts on log frequency changes.
Sentry Logs is designed specifically for application debugging rather than general log storage. Sentry automatically attaches trace IDs and span IDs to every log statement emitted by your application framework. When inspecting an error or a performance trace in Sentry, you can view the surrounding application logs in the exact temporal context of the failed request.
Sentry is not designed to ingest gigabytes of system syslog files, NGINX access logs, or database query logs. If your compliance or operations requirements demand a centralized log management tool for all cloud infrastructure, Datadog is built for that scale, whereas Sentry is strictly focused on debugging application log lines.
4. Frontend and User Experience Monitoring
SaaS platforms live or die by user experience. A bug in a React or Vue frontend that silently breaks a checkout button can devastate conversion rates without ever triggering a backend server error.
Sentry offers exceptional frontend observability through Session Replay and Web Vitals tracking. Session Replay records DOM state changes, user clicks, mouse movements, network calls, and console logs, producing a video-like playback of what the user experienced prior to a crash.
Sentry automatically masks sensitive user information, email addresses, and form input fields at the client browser level before transmitting replay telemetry. If an end user hits a JavaScript exception on an billing page, a developer can click watch replay in Sentry to view the exact sequence of user actions that triggered the state bug.
Datadog provides frontend monitoring through its Real User Monitoring (RUM) and Synthetic Monitoring products. Datadog RUM tracks client-side session performance, Core Web Vitals, user journeys, and page load latency across global regions. Datadog Synthetics allows teams to run automated headless browser scripts from dozens of global location points to verify that critical SaaS user flows remain operational.
While Datadog RUM provides macro-level insight into user performance metrics across geographic regions, Sentry's Session Replay provides more immediate value to frontend developers trying to reproduce tricky, state-dependent UI bugs.
AI Debugging Agents: Sentry Seer vs. Datadog Bits AI
AI-assisted debugging features have transformed production incident response, and both platforms have deployed distinct AI agents.
Sentry's AI engine, Seer, focuses directly on root cause analysis and automated code remediation. When Sentry captures an unhandled exception, Seer analyzes the stack trace, surrounding application logs, and recent code commit history. It synthesizes this context to explain the root cause in plain human language and can generate a draft pull request on GitHub or GitLab containing the exact code fix.
Datadog's AI agent, Bits AI SRE, is engineered for autonomous system-level incident triage. When a critical monitor fires in Datadog, Bits AI initiates an automated investigation. It scans cloud infrastructure metrics, service dependency graphs, recent deployment events, and log anomalies to isolate the failing component. Bits AI communicates through Slack or Microsoft Teams, providing site reliability engineers with a summary of system health across microservices.
In short: Sentry Seer works like an automated software engineer that fixes broken code lines, while Datadog Bits AI works like an automated SRE that triages system infrastructure outages.
Pricing Breakdown: Uncovering the Hidden Costs
Pricing structure is frequently the decisive factor when SaaS engineering teams choose between Sentry and Datadog. The platforms use fundamentally different billing engines.
Sentry Pricing Mechanics
Sentry charges based on event consumption volume rather than seat counts or individual server hosts. Every paid tier includes unlimited user seats and unlimited application projects.
Sentry offers four main pricing tiers:
- Developer Tier (0 USD per month): Designed for solo developers and side projects. Includes 5,000 error events per month, 10,000 performance units, 50 session replays, and 5GB of logs.
- Team Tier (26 USD per month when billed annually): Built for growing engineering teams. Includes 50,000 error events, 5M tracing spans, 500 session replays, 5GB of logs, unlimited seats, and third-party integrations with tools like GitHub and Jira.
- Business Tier (80 USD per month when billed annually): Designed for multi-team SaaS organizations. Includes advanced metric analytics, custom dashboards, SAML single sign-on (SSO), data volume controls, and higher baseline usage quotas.
- Enterprise Tier (Custom Pricing): Provides custom data retention schedules, dedicated support SLAs, HIPAA and SOC2 compliance guarantees, and single-tenant data locality options.
Sentry's pay-as-you-go pricing for extra events is linear and predictable. If your application experiences a temporary spike in errors, Sentry bills add-on events at clear tier rates (for example, approximately 0.00036 USD per additional error event on Team plans). Data spikes will not result in massive unexpected invoices because teams can set explicit monthly spend caps in the Sentry console.
Datadog Pricing Mechanics
Datadog uses a modular, per-product, per-host billing model. There is no single subscription price; your total monthly invoice is the cumulative sum of every product module enabled across every server host, container, or log pipeline.
Common Datadog module costs include:
- Infrastructure Monitoring: Starts at 15 USD per host per month (billed annually) or 18 USD per host on-demand.
- APM (Application Performance Monitoring): Starts at 31 USD per host per month (billed annually). Requires an active Infrastructure plan, bringing the true baseline APM host cost to 46 USD per host per month.
- Log Management: Ingestion costs 0.10 USD per GB, plus 1.70 USD per million indexed events (for a 15-day retention period).
- Real User Monitoring (RUM): Starts at 1.50 USD per 1,000 sessions.
- Custom Metrics: Every host plan includes a baseline allotment of custom metrics (100 to 200 per host). Exceeding this quota costs roughly 1.00 USD per 100 additional custom metrics.
- Synthetics: Costs 12 USD per 1,000 browser test runs and 5 USD per 10,000 API test runs.
Practical Cost Scenario Comparison

To see how these billing structures impact budget forecasting, consider a mid-sized B2B SaaS startup running a modern containerized infrastructure setup:
- Engineering Team: 20 software developers
- Infrastructure Footprint: 50 cloud compute hosts (or Kubernetes nodes running 300 microservice containers)
- Traffic Volume: 50 million API requests per month, generating 500,000 application errors, 20 million performance spans, and 200GB of log data
Here is how the estimated monthly costs compare for this scenario:
| Pricing Element | Sentry Estimated Cost | Datadog Estimated Cost |
|---|---|---|
| Base Platform Plan | 80 USD per month (Business Tier) | 0 USD (Modular base) |
| User Seats | Included (Unlimited) | Included |
| Host Infrastructure | 0 USD (Not tracked) | 750 USD per month (50 hosts x 15 USD) |
| APM and Tracing | 150 USD per month (Span volume add-on) | 1,550 USD per month (50 hosts x 31 USD) |
| Error and Log Storage | 120 USD per month (Error/Log volume add-on) | 350 USD per month (200GB ingest + indexing) |
| Custom Metrics / Add-ons | 0 USD | 300 USD per month (Custom metrics overage) |
| Total Estimated Monthly Cost | ~350 USD per month | ~2,950 USD per month |
In this scenario, Datadog costs roughly eight times as much as Sentry. This massive price difference occurs because Datadog's pricing scales directly with infrastructure size (host count), while Sentry's pricing scales with application event volume. For engineering teams operating dozens of lightweight container hosts or serverless functions, Datadog's per-host billing model can escalate quickly.
Developer Experience and Setup Complexity
Integrating monitoring tools into your codebase and deployment workflows should accelerate development rather than create friction.
Installing and Configuring Sentry
Sentry is simple to set up for application developers. Installing Sentry typically requires adding a single lightweight SDK library to your application framework, initializing the client with a Data Source Name (DSN) key, and wrapping your application handler.
Here is how initializing Sentry looks in a modern Node.js or TypeScript application:
```typescript import * as Sentry from '@sentry/node';
Sentry.init({ dsn: 'https://examplePublicKey@o0.ingest.sentry.io/0', tracesSampleRate: 0.2, profilesSampleRate: 0.1, environment: process.env.NODE_ENV, release: process.env.GIT_COMMIT_SHA, }); ```
Once configured, Sentry automatically hooks into unhandled promise rejections, express middleware errors, database clients, and outbound HTTP libraries. Developers can test Sentry locally in minutes without configuring background daemons or infrastructure agents.
Installing and Configuring Datadog
Setting up Datadog requires an operational commitment. To get full value from Datadog, system administrators must install and configure the Datadog Agent on host virtual machines, run it as a DaemonSet in Kubernetes, or deploy lightweight sidecars in ECS.
Configuring the agent involves managing configuration files (datadog.yaml) to grant read permissions for system logs, container runtime sockets, and cloud integrations. Application tracing then requires injecting language-specific auto-instrumentation packages (dd-trace) into your runtime startup scripts.
While this infrastructure agent enables unified host-level visibility, it introduces maintenance overhead. DevOps teams must manage agent updates, configure agent resource limits, and maintain IAM roles across cloud accounts.
Four Mistakes SaaS Teams Make When Choosing
Engineering leaders frequently fall into predictable traps when evaluating monitoring vendors.
Mistake 1: Treating Sentry as a Full Infrastructure Suite
Sentry excels at code debugging, but it is not a replacement for infrastructure monitoring. If your PostgreSQL database hits disk capacity, your Kubernetes API server experiences control plane degradation, or your AWS NAT gateway drops packets, Sentry will not alert you until your application code starts throwing HTTP 500 errors. Expecting Sentry to monitor cloud server health leads to blind spots during infrastructure outages.
Mistake 2: Buying Datadog Purely for Exception Tracking
Buying Datadog solely because your engineering team needs error monitoring is a costly mistake. Datadog's per-host APM pricing model means you will pay premium rates for server metrics and service maps when all your developers wanted was an organized list of stack traces and release attribution. If your primary problem is squashing application bugs, Sentry delivers superior developer workflows at a fraction of the cost.
Mistake 3: Overlooking Datadog's Custom Metrics Charges
Datadog's base pricing looks manageable on paper, but custom metrics fees frequently catch teams off guard. If developers attach high-cardinality tags (such as user_id or transaction_id) to custom application metrics in Datadog, every unique tag combination creates a distinct custom metric stream. A single misconfigured custom metric can generate thousands of metric streams, adding hundreds or thousands of dollars to your monthly Datadog bill.
Mistake 4: Ignoring Frontend Session Privacy and Overhead
Deploying frontend session replays or RUM scripts without privacy controls can inadvertently capture sensitive customer PII or slow down browser rendering. Always verify that client-side SDKs properly scrub sensitive DOM inputs, passwords, credit card numbers, and authorization headers before shipping monitoring agents to production.
Decision Framework: Which Tool Fits Your SaaS?
Choosing between Sentry and Datadog comes down to team architecture, operational maturity, and budget constraints.
Choose Sentry If:
- You run a fast-moving product team focused on rapid feature deployment and bug fixes.
- You need top-tier error deduplication, stack trace inspection, and suspect commit tracking.
- Your frontend application relies heavily on state management, where video-like Session Replays speed up QA debugging.
- You want predictable, event-volume billing with unlimited user seats and project workspaces.
- You operate on AWS, GCP, or Vercel, relying on cloud provider native metrics (AWS CloudWatch, GCP Cloud Monitoring) for basic server monitoring.
Choose Datadog If:
- You manage an enterprise SaaS platform with hundreds of server hosts, microservices, and Kubernetes clusters.
- You need a single pane of glass for infrastructure metrics, container logs, network performance, SIEM security, and distributed APM.
- You have dedicated DevOps or Site Reliability Engineering (SRE) teams who build real-time operational dashboards and complex alerting pipelines.
- You require enterprise compliance, security monitoring, and synthetic endpoint probing from global locations.
- You have the budget to support multi-variable per-host and per-log usage billing.
The Hybrid Strategy: Using Sentry and Datadog Together
Many high-growth SaaS companies choose a hybrid approach:
- Datadog Infrastructure and Log Management: Deployed across cloud hosts, databases, and network edge proxies for site reliability engineers and operations teams.
- Sentry Error Tracking and Session Replay: Embedded directly in web, mobile, and backend code for software developers to triage application bugs.
By leveraging Sentry for developer debugging and Datadog for system infrastructure, engineering organizations provide every team member with the right specialized tool while controlling overall observability costs.
When evaluating developer tools and infrastructure platforms for your SaaS stack, getting unbiased comparison data is critical. At Saasbonus, we publish independent, hands-on reviews, teardowns, and software cost analyses to help engineering leaders choose the right tools the first time.